JBoss ESB 4.2 GA
Monitoring Guide
JBESB-MG-9/5/07
Legal
Notices
The
information contained in this documentation is subject to change
without notice.
JBoss Inc.
makes no warranty of any kind with regard to this material,
including, but not limited to, the implied warranties of
merchantability and fitness for a particular purpose. JBoss Inc.
shall not be liable for errors contained herein or for incidental or
consequential damages in connection with the furnishing, performance,
or use of this material.
Java™
and J2EE is a U.S. trademark of Sun Microsystems, Inc. Microsoft®
and Windows NT® are registered trademarks of Microsoft
Corporation. Oracle® is a registered U.S. trademark and Oracle9™,
Oracle9 Server™ Oracle9 Enterprise Edition™ are
trademarks of Oracle Corporation. Unix is used here as a generic term
covering all versions of the UNIX® operating system. UNIX is a
registered trademark in the United States and other countries,
licensed exclusively through X/Open Company Limited.
Copyright
JBoss, Home
of Professional Open Source Copyright 2006, JBoss Inc., and
individual contributors as indicated by the @authors tag. All rights
reserved.
See the
copyright.txt in the distribution for a full listing of individual
contributors. This copyrighted material is made available to anyone
wishing to use, modify, copy, or redistribute it subject to the terms
and conditions of the GNU General Public License, v. 2.0. This
program is distributed in the hope that it will be useful, but
WITHOUT A WARRANTY; without even the implied warranty of
MERCHANTABILITY or FITNESS FOR A PARTICULAR PURPOSE.
See the GNU
General Public License for more details. You should have received a
copy of the GNU General Public License, v. 2.0 along with this
distribution; if not, write to the Free Software Foundation, Inc., 51
Franklin Street, Fifth Floor, Boston, MA 02110-1301, USA.
Software
Version
JBoss ESB 4.2 GA
Restricted
Rights Legend
Use,
duplication, or disclosure is subject to restrictions as set forth in
contract subdivision (c)(1)(ii) of the Rights in Technical Data and
Computer Software clause 52.227-FAR14.
©
Copyright 2007
JBoss Inc.
Contents
Contents iii
iii
About
This Guide iv
What
This Guide Contains iv
Audience iv
Prerequisites iv
Organization iv
Documentation
Conventions iv
Additional
Documentation v
Contacting Us v
Installation
vi
Overview vi
Monitoring viii
Console viii
Services viii
MessageCounter viii
Transformations ix
About
This Guide
What This Guide
Contains
The
Monitoring Guide contains instructions on how to use the JBoss ESB
monitoring console and how to extend if for your purposes. The
Guide is current as of JBoss ESB 4.2 GA.
Audience
This
guide is most relevant to engineers who are responsible for using JBoss ESB 4.2 GA
installations and want to know how monitor their ESB
instance for performance.
Prerequisites
You
will need the JBossESB distribution, source or binary to run the
trailblazer. You will also need an instance of JBoss Application
Server (jboss-4.2.0.GA or greater) or the JBoss ESB Server
4.2.0.GA.
Organization
This
guide contains the following chapters:
Chapter
1, Installation:
an overview of the installation procedure.
Chapter
2, Monitoring:
a description of what you can monitor.
Documentation
Conventions
The
following conventions are used in this guide:
|
Convention |
Description |
|
Italic |
In paragraph text,
italic identifies the titles of documents that are being
referenced. When used in conjunction with the Code text
described below, italics identify a variable that should be
replaced by the user with an actual value. |
|
Bold |
Emphasizes items
of particular importance. |
|
Code |
Text that
represents programming code. |
|
Function
| Function |
A path to a
function or dialog box within an interface. For example,
“Select File | Open.” indicates that you should
select the Open function from the File menu. |
|
( ) and | |
Parentheses
enclose optional items in command syntax. The vertical bar
separates syntax items in a list of choices. For example, any of
the following three items can be entered in this syntax:
persistPolicy
(Never | OnTimer | OnUpdate | NoMoreOftenThan) |
|
Note:
Caution: |
A note highlights
important supplemental information.
A caution
highlights procedures or information that is necessary to avoid
damage to equipment, damage to software, loss of data, or
invalid test results. |
Table
1 Formatting Conventions
Additional
Documentation
In
addition to this guide, the following guides are available in the JBoss ESB 4.2 GA
documentation set:
JBoss ESB 4.2 GA
Administration
Guide:
How to manage the ESB.
JBoss ESB 4.2 GA
Getting
Started Guide:
Provides a quick start reference to configuring and using the ESB.
JBoss ESB 4.2 GA
Programmers
Guide:
How to use JBossESB.
JBoss ESB 4.2 GA Release
Notes: Information on the differences between this release and
previous releases.
JBoss ESB 4.2 GA Services
Guides: Various documents related to the services available with
the ESB.
Contacting Us
Questions
or comments about JBoss ESB 4.2 GA
should be directed to our support team.
Chapter 1
Installation
Overview
The
JBossESB monitoring console gathers information on the performance
of different ESB services that are deployed and keeps historical
state information over a period of time. As of JBoss ESB
4.2.0.GA, the monitoring console allows users to get message counts
by service, action, and node, as well as other information like
processing time, number of failed messages, bytes transferred, and
last successful and failed message date time.
Installing
the JBoss ESB monitoring console is fairly easy. The console
uses hsqldb as a database by defalt, so you can install with the
steps of :
%
cd tools/console/management-esb
% ant deploy
Point
your browser to http://localhost:8080/jbossesb
Alternative
database usage:
If
you'd like to use a database other than hsqldb as a back-end, the
console has also been tested with Oracle and MySQL – and
could be extended to use any JDBC/Hibernate-supported database.
In
the management-esb directory there is a db.properties file. In
order to change the database from hsqldb to MySQL or Oracle, edit
this file and change the db property to “MySQL” or
“Oracle” respectively. You will also need to add
your JDBC driver into the server/<instance>/lib directory of
your application server – JBoss ships with hsqldb.jar in this
directory by default.
For
MySQL, it also may be necessary to create the database “statistics”
before deploying. Please look over the management-ds.xml for
your database in the /management-esb/src/main/resources/<db>
directory.
Collection
Periods
The
period of time between data collections is 10 minutes by default,
but it can be set to any period of minutes that is desired.
The default collection period can be changed at build time by
changing the “pollMinuteFrequency” property in
management-esb/db.properties, or by changing the
PollMinuteFrequency property in the
jboss.esb:service=DataFilerScheduler Mbean in the monitoring
console or in jmx-console.
Chapter 2
Monitoring
Console
The
console can be found at http://localhost:8080/jbossesb
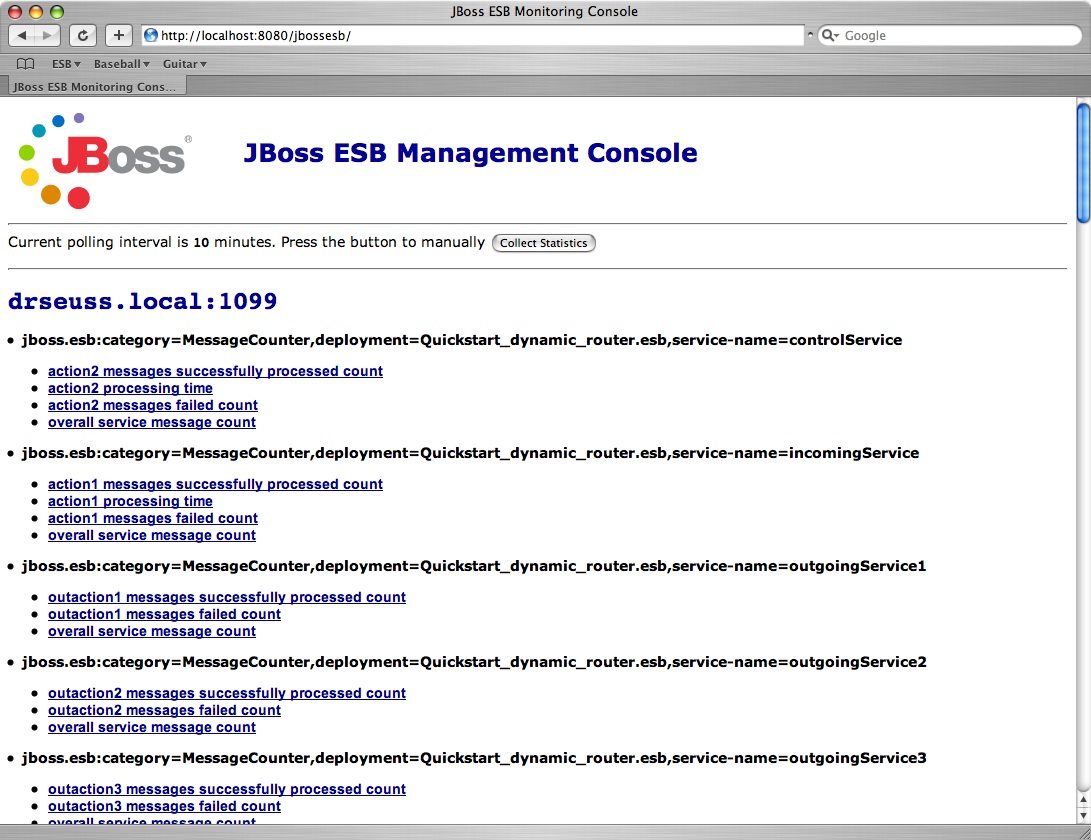
Below
is a screenshot of the console. The console requests MBean
information from each node within the ESB registry, and then
displays it back. Any attribute hat is a processing time a
count is shown with a chart and a time sorted list, which all other
data is displayed with just a time sorted list.
Polling
The
console's polling default is 10 minutes, which can be changed at
build time or through the jmx-console. The “Collect
Statistics” button shown in the header allows a user to force
a statistics collection.
Services
Each
ESB service is displayed along with the processing time per action,
processed count per action, failed count per action, and overall
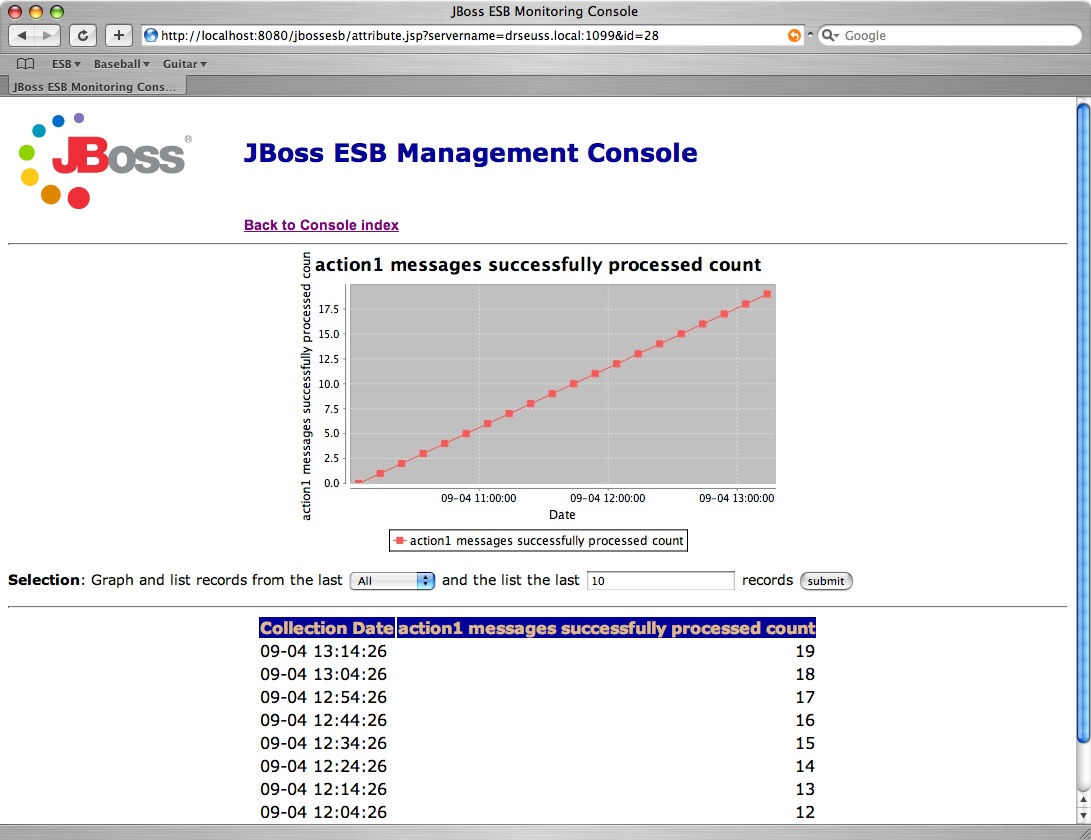
message count (per service). If you select any of these
options, you should see a screen that charts the count or time you
have selected.
By
default, the last 10 records are displayed. You can display
more records by changing the display records text box or you can
change the charting time period (graph over the last 5 minutes,
hour, day, week, month, or graph all records).
See
below:
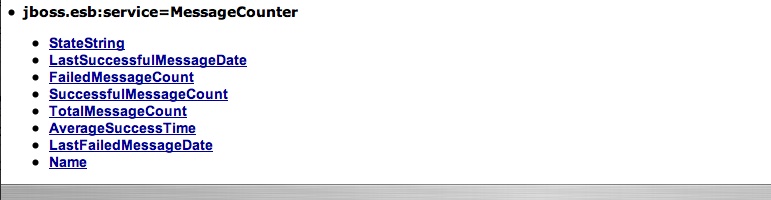
MessageCounter
The
monitoring console also provides an overall counter which counts
all messages that pass through the ESB. The MessageCounter
keeps track of the successful and failed message counts, as well as
time and date.
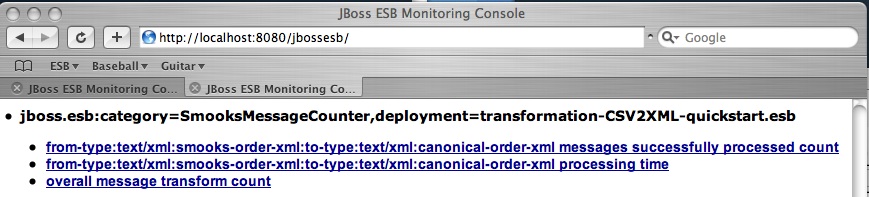
Transformations
For
each Smooks Transformation that is registered, the monitoring
console keeps track of the processed count for each transformation,
processing time for each transformation, and the overall count for
the transformation chain.