You need to actively monitor your processes to make sure you can detect any anomalies and react to unexpected events as soon as possible. Business Activity Monitoring (BAM) is concerned with real-time monitoring of your processes and the option of intervening directly, possibly even automatically, based on the analysis of these events.
jBPM allows users to define reports based on the events generated by the process engine, and possibly direct intervention in specific situations using complex event processing rules (Drools Fusion), as described in the next two sections. Future releases of the jBPM platform will include support for all requirements of Business Activity Monitoring, including a web-based application that can be used to more easily interact with a running process engine, inspect its state, generate reports, etc.
By adding a history logger to the process engine, all relevant events are stored in the database. This history log can be used to monitor and analyze the execution of your processes. We are using the Eclipse BIRT (Business Intelligence Reporting Tool) to create reports that show the key performance indicators. Its easy to define your own reports yourself, using the predefined data sets containing all process history information, and any other data sources you might want to add yourself.
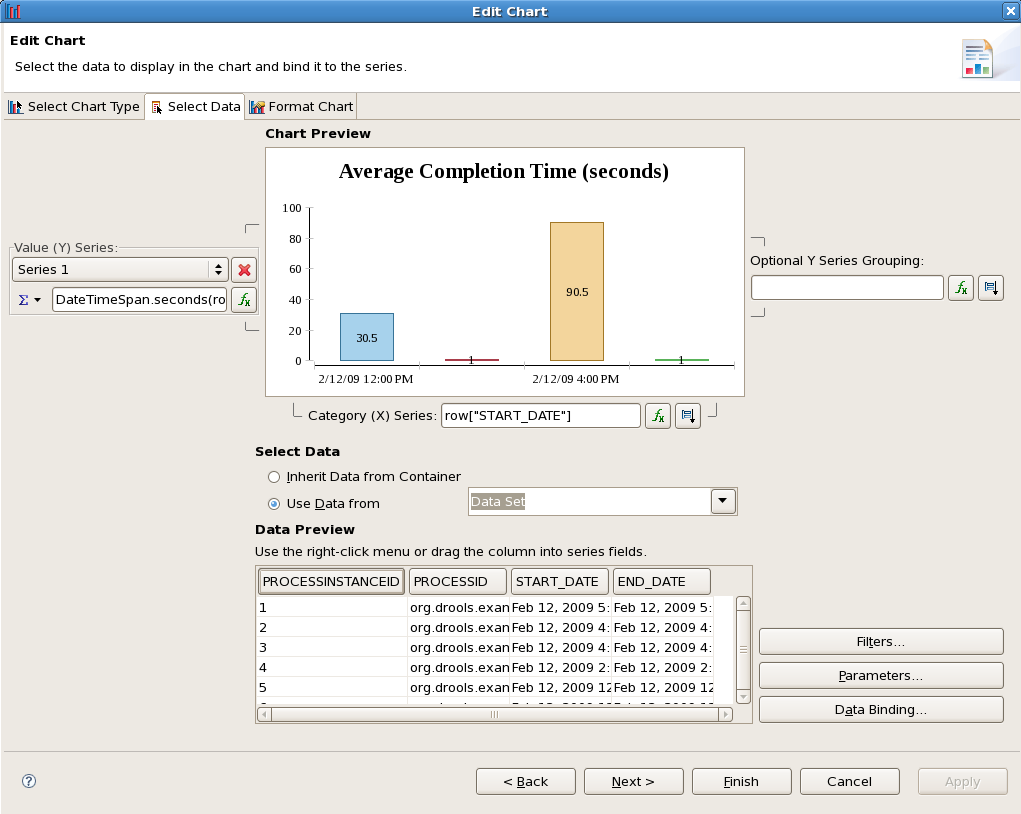
The Eclipse BIRT framework allows you to define data sets, create reports, include charts, preview your reports, and export them on web pages. (Consult the Eclipse BIRT documentation on how to define your own reports.) The following screen shot shows a sample on how to create such a chart.
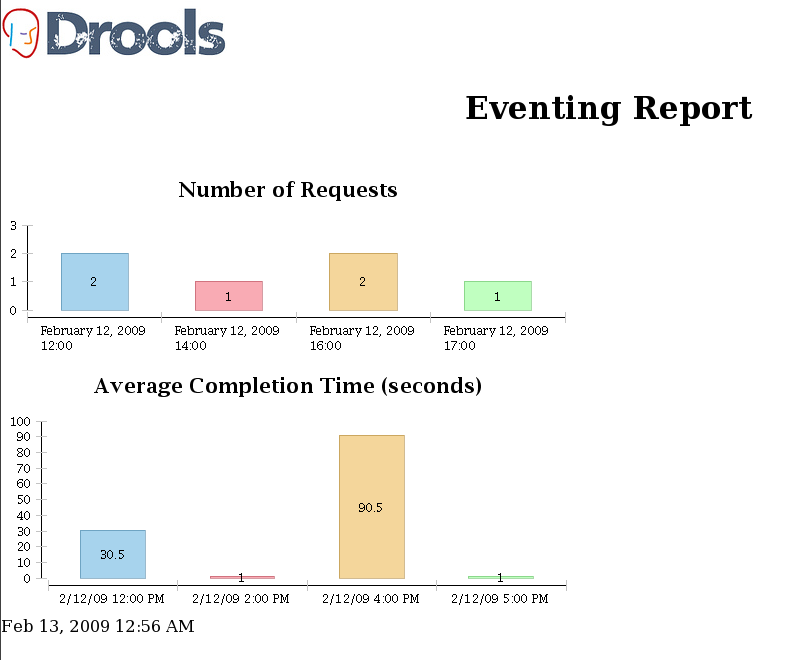
The next figure displays a simple report based on some history data, showing the number of requests per hour and the average completion time of the request during that hour. These charts could be used to check for an unexpected drop or rise of requests, an increase in the average processing time, etc. These charts could signal possible problems before the situation really gets out of hand.
Reports can be used to visualize an overview of the current state of your processes, but they rely on a human actor to take action based on the information in these charts. However, we allow users to define automatic responses to specific circumstances.
Drools Fusion provides numerous features that make it easy to process large sets of events. This can be used to monitor the process engine itself. This can be achieved by adding a listener to the engine that forwards all related process events, such as the start and completion of a process instance, or the triggering of a specific node, to a session responsible for processing these events. This could be the same session as the one executing the processes, or an independent session as well. Complex Event Processing (CEP) rules could then be used to specify how to process these events. For example, these rules could generate higher-level business events based on a specific occurrence of low-level process events. The rules could also specify how to respond to specific situations.
The next section shows a sample rule that accumulates all start process events for one specific order process over the last hour, using the "sliding window" support. This rule prints out an error message if more than 1000 process instances were started in the last hour (e.g., to detect a possible overload of the server). Note that, in a realistic setting, this would probably be replaced by sending an email or other form of notification to the responsible instead of the simple logging.
declare ProcessStartedEvent
    @role( event )
end

dialect "mvel"

rule "Number of process instances above threshold"
when
  Number( nbProcesses : intValue > 1000 )
    from accumulate(
      e: ProcessStartedEvent( processInstance.processId == "com.sample.order.OrderProcess" )
      over window:size(1h),
      count(e) )
then
  System.err.println( "WARNING: Number of order processes in the last hour above 1000: " +
                      nbProcesses );
end
These rules could even be used to alter the behavior of a process automatically at runtime, based on the events generated by the engine. For example, whenever a specific situation is detected, additional rules could be added to the Knowledge Base to modify process behavior. For instance, whenever a large amount of user requests within a specific time frame are detected, an additional validation could be added to the process, enforcing some sort of flow control to reduce the frequency of incoming requests. There is also the possibility of deploying additional logging rules as the consequence of detecting problems. As soon as the situation reverts back to normal, such rules would be removed again.