The Portlet 2.0 specification provides a new eventing feature for coordinating several portlets. This long awaited feature is very powerful but can sometime lead to complex scenarios when multiple events are consumed and fired by multiple portlets on the same page.
The simple portal provides a visual debugger that can be used to understand what happens during the event phase orchestrated by the portal. It comes as a portlet that you can place on any page and it shows a tree of events that were produced and consumed during the event phase.
|
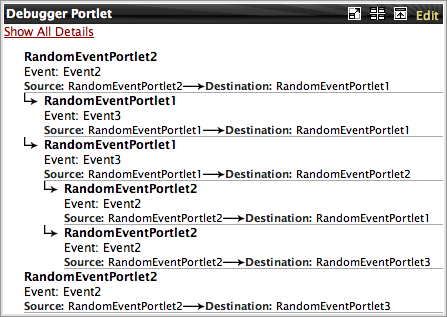
Event debugger portlet.
The event debugger displays a tree of events produced and consumed by portlets. The nodes of the tree don't represent events, they rather represent event routings from a source portlet to a destination portlet. By default it shows the name of the portlet that published the event, the event name and the destination of the event that was chosen by the simple portal during the event distribution phase. Hovering the mouse on a node shows more information.

|
Event debugger portlet.
When hovering the mouse on a node you can see the optional event payload represented by
the string returned when invoked its toString() method and the state of the portlet
after the event phase. The state of the portlet consist in its portlet mode, its window state and the
set of its render parameters. Adding the event debugger to a page is easy.
...<xportal:portlet name="DebuggerPortlet" applicationName="simple-portal"/>...
Example 3.9. Adding the event debugger to a portal page