RHQ 4.9
Browser Javascript Consoles
Browsers continue to get more sophisticated all the time. Fortunately, we can use some of the new technology now to help us diagnose the state of things leading up the issue. Browser logs, just like server logs, are a very helpful diagnostic tool. Browser logs take the form of a javascript console that RHQ GUI sends its logs. GWT has a logging facility similiar to log4j that allows logging to the browser console. Exception stack traces and events leading up to the exception can be traced in these logs providing a more complete context of the problem.
GWT Logging
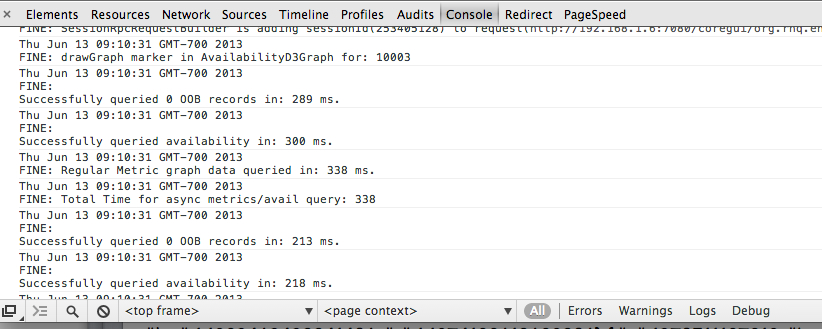
We log the GWT 'FINE' (Debug) level events to the browser console. If there any exceptions occuring in the UI they will be logged here and any pertinent messages leading up to the issue will also be logged giving us a better understanding of the system state when the issue occurred. For example, all of the raw graph data from the metrics service is logged. This makes it easy to separate the raw inputs from the processing done in the UI screen rendering via the SmartGWT widgets.
Chrome
To show the javascript console use Chrome (right click and select 'inspect element' then select 'Console' from the set of tabs on the bottom of the screen.
Ctrl - Shift - J or on Mac: Cmd - Shift - J
FireFox
For FireFox the default browser console doesn't seem to work for displaying the logs but installation of the FireBug addon works great: http://getfirebug.com/. Once Firebug is addon is installed into FireFox just right click in the page and select 'Inspect Element with Firebug' and make sure the 'Console' tab is selected below. See Firebug console below:

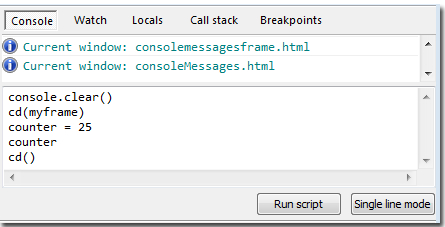
Internet Explorer
IE also has a console feature. Use F12 to access the 'Developer Tools'.
These browser console logs can then be pasted mailed or better, put in a pastebin and linked.