This page contain the report from the Performance Engineering team for Sprint 3.
Learning to crawl
Lets start by proclaiming that RHQ / jBoss and even Postgresql are new to the Performance Engineering Team. As I start working with the development team in Sprint 3, our goal was to learn our way around, people, terminology, process and technology. Sponge mode here I come.
Goals / Tasks
The main goals for Sprint 3 were:
-
to learn my way around.
-
To get a basic install up and running and poke at things
-
To learn to use the perftest plugin
-
To get a Windows agent up and measure the load it puts on the err, platform.
-
To get enough knowledge to be able to form a basic performance plan of attack (its not really going to be a pure test plan).
Accomplishments
With a lot support from folks, especially mazz, Adam and Mike, I was able to accomplish all of the tasks and meet the overall goals.
-
I intentionally installed Postgres to the system disk in order to introduce a bottleneck.
-
I learned how to use pgFouine, a really nice SQL log analysis tool (thanks to our friends at EnterpriseDB for the tip.
-
Disclaimer Red Hat recently invested in EnterpriseDB.
-
-
mazz walked me through the agentcopy and agent spawn stuff and I was able to create lots of agents to bring the RHQ server to its knees
-
I used a 1 VCPU, 1GByte KVM guest running Windows2K3(tm) to serve as a low end system and installed the RHQ agent and measured the performance impact on the guest.
-
Developed plan to test with over the long holiday break
Results / Analysis
Test Group #1
In the initial tests, I installed both Postgres and RHQ on the same eight core box with 8GBytes of memory. I tried to follow the basic instructions for configurations of the server and Postgresql. For this sprint I had several other boxes available for my drivers. Most are fairly small four core boxes with between 2 and 6 GB of memory. However I also used a bigger Nehalem based machine with 24 GB of fast memory. I was actually able to create over 100 instances of the agentcopy agent running the perftest plugin on this box. This helped bring the poorly configured RHQ server to its knees. (lesson learned). I was able to observe that the storage would rarely max out but it was getting somewhat high await times indicating some IO pressure. However the CPUs were also very busy. During this time I was also monitoring the log4j file and observed many statement timeouts (it was initially set to 30 sec and then bumped higher.)
There was also a "bad" query that I logged BZ548172 .
One other thing that I noticed was the ANALYZE command would almost always timeout. It also reported some errors that I interpreted to mean it was trying to analyze some of the Postgresql system tables. I did some digging and found that the code just calls ANALYZE without specifying any specific tables.
Test Group #2
In trying to determine where the bottlenecks were, I then reinstalled things and put the Postgresql DB onto a MSA based storage. I also disabled the statement timeout to see how long the different statements take to complete. On the server I used taskset when I started both the database and the RHQ server. By pinning the processes in this manner I was able to:
-
leverage cache coherency
-
Use mpstat to track the CPU consumption of each component
This time I didn't load the server as much. Basically this was the load that that was running for most of this time period.
-
Platform Total 24
-
Server Total 270
-
Service Total 11681
For tools I investigated several tools to analyze the queries based on the logs. I settled on pgFouine . This tool breaks the queries out by total run time, longest query, etc. Note that EXPLAIN will give you the query plan and estimated cost, but these tools go much deeper in a more system wide manner. The disadvantage is that you need to log all of the queries and the times it takes to run then to a file system. Running the data collection on my system, I found that I could eat up 45% of my IO bandwidth going to the MSA. So the use of this tool definitely can impact the tests. Both due to bandwidth but also due to the reliance of Postgresql on the page cache, However, it does seem to provide some decent data to analyze. The first example shows shows several different breakdowns of queries. This second page shows how pgFouine can be used to break down the different queries over time. (Note that I haven't really gone in and analyzed the hourly data yet)
Overall, I found that there was a fairly low utilization of the IO by the database. There is clearly a cyclic nature to the IO which corresponds to the "top of the hour". This is illustrated in the following charts.
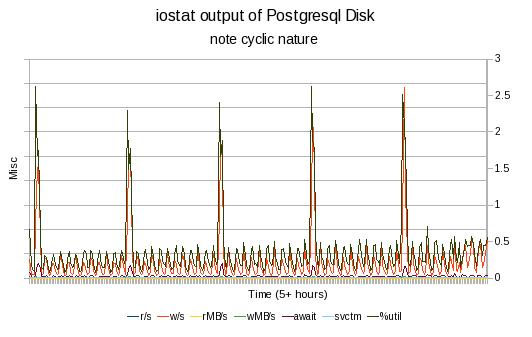
This graph is fairly busy and is really only intended to show that there is a clear period to the IO activity. The chart above is for roughly five hours of iostat data while the RHQ server is in "steady state" mode gather metrics and performing its hourly routines. The next two graphs will look at things with a little finer resolution.
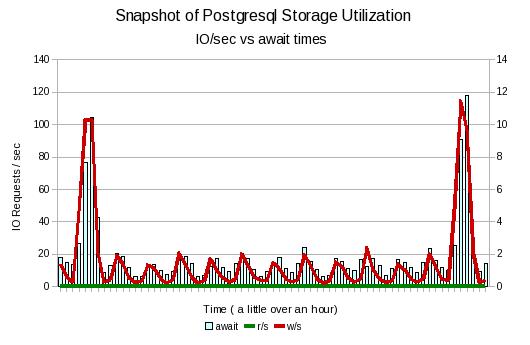
The graph above plots the number of reads and writes per second vs the await times for the database storage device. The time scale has been limited to just over an hour to provide better resolution. Basically each spike is an hour apart. Several things jump out here.
-
There are no reads going on, This means any reads are still coming out of the page cache.
-
The await times go up during the period of greater write activity. (await is the time for the entire IO operation to complete (includes cache)
The last IO graph shows the response times in more detail.
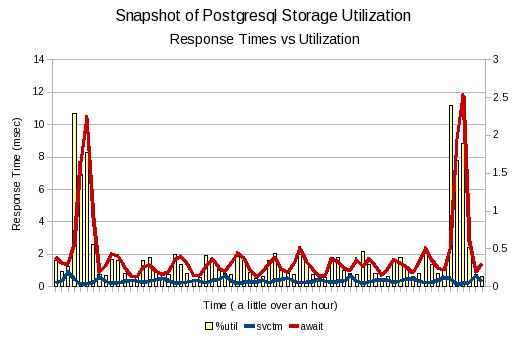
Here you can see that the increase in await times also align with the %utilization times reported by iostat. Note that the %utilization time is plotted against the second Y-axix on the right. Looking at the data you can see that the utilization never goes above 2.5% . The svctm metric is the time it takes the disk to service the request. You can notice that it actually decreases as the await increases. Probably due to better batching to the storage.
I also collected CPU statistics during the runs. Due to affinity settings, I am able to provide a quick and dirty breakdown of the utilization of the DB vs RHQ . I didn't have complete isolation of all the processes on the system, but the data should provide a rough estimate. So the first graph below show the 5 hour run. There are spikes on the 1/2 hour that don't really show up in the iostats output. 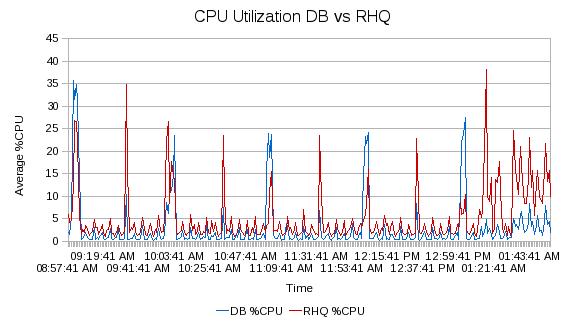
The following graph is a higher resolution as it spans just more than an hour. ( The timeframe is basically the same as the iostats hourly above)
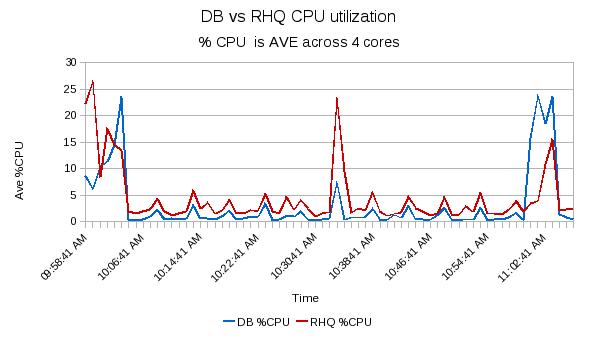
In the chart above, you can see that the RHQ server typically takes up more of the CPU than the database. The spikes in the CPU utilization of the database correspond to the "top of the hour" where we know that the RHQ server does some maintenance. It would be interesting to disable the ANALYZE and any vacuums to see if they are the specific cause of those spikes. The other concern based on this data is the amount of headroom that is required so that the user interface will be able to maintain decent response times when under load during the maintenance periods.
Test Group #3
This final set of tests was to designed to look at the resource utilization of some low end platforms. I set up a 1 VCPU KVM based guest with 1GB memory. The guest has two network interfaces, one for the lab net and a one for the private 1Gbit LAN that I use a private network for better control during testing. The following two charts show the results. 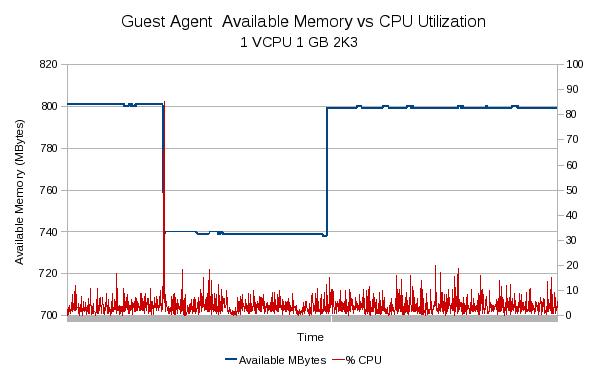
In the chart above you can see the amount of available memory will drop when the agent as expected. There looks like not quite all of it gets recovered when the agent is complete. Outside of a quick spike on startup (again, to be expected), it doesn't look like the agent uses much for CPU resources. 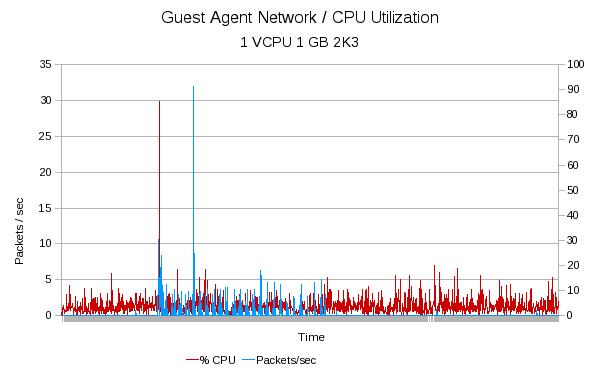
In the graph above You can see the CPU utilization compared to the network usage for the private LAN. The timescale and CPU data is the same as the previous graph so we know that the large spike in CPU resources corresponds to the agent start up. It also at this time that you see the beginning of a small amount of traffic on the LAN. Overall, it doesn't look like the agent uses up much resources on the guest being monitored.
Watches
These are things that need more investigation. Not sure if we should file a BZ for them before they are investigated or if we should gather more data first.
-
The use of the ANALYZE should be reviewed. It may be more feasible to get a list of tables and then run against each one.
-
We currently recommend a statement timeout of 30 seconds, the Postgresql docs say that you should not set this in a global fashion
-
I noticed that the Postgresql plugin was reporting a lot of Rollbacks. Need to see if this is a bug in the reporting or if we are really rolling back transactions (and why)
-
From observing the log4j files, it looks like we are trying to remove old data every hour. In theory this puts a larger load on the database as you need to locate the data, remove it and deal with any indexes, views etc. There are some other potential solutions that could yield less stress on the server but would store more data and require some code changes. However, this is probably worth an investigation.
-
We also need to start on scalability tests. It seems like the server should be able to handle a bigger load.
Next Steps
I am planning on splitting the DB from the server and running a large load over the holidays. I'll automated some scripts and take snapshots of the systems at various points. This is an informal run and there is no real written test plan.