
Benchmark report
Summary
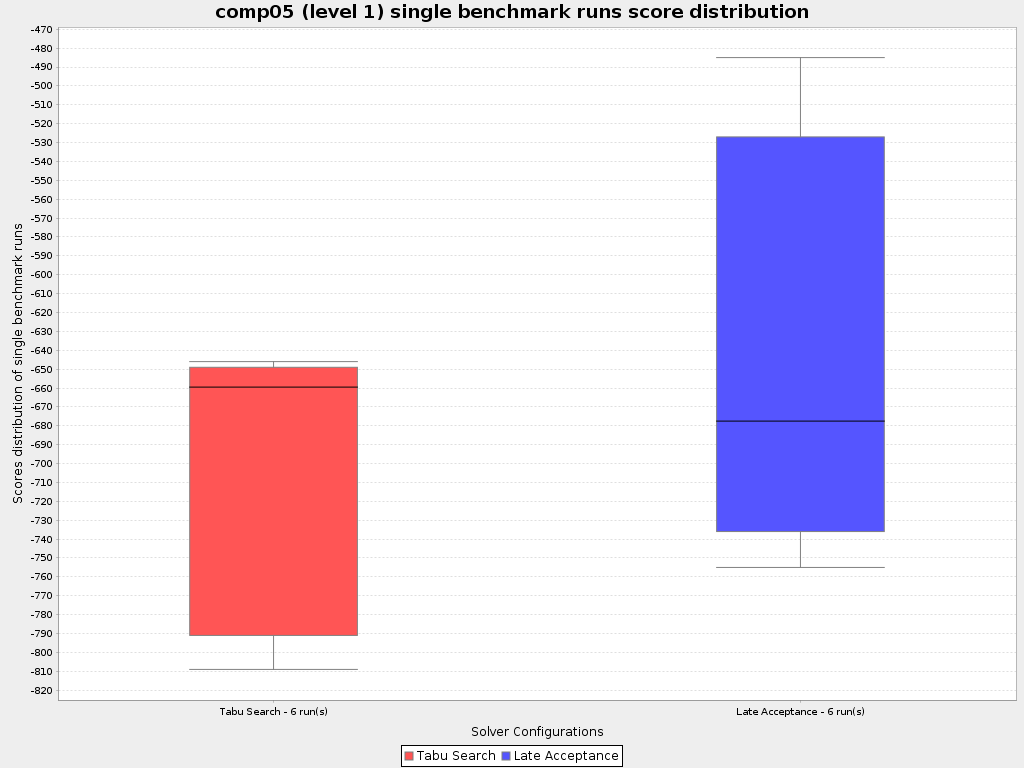
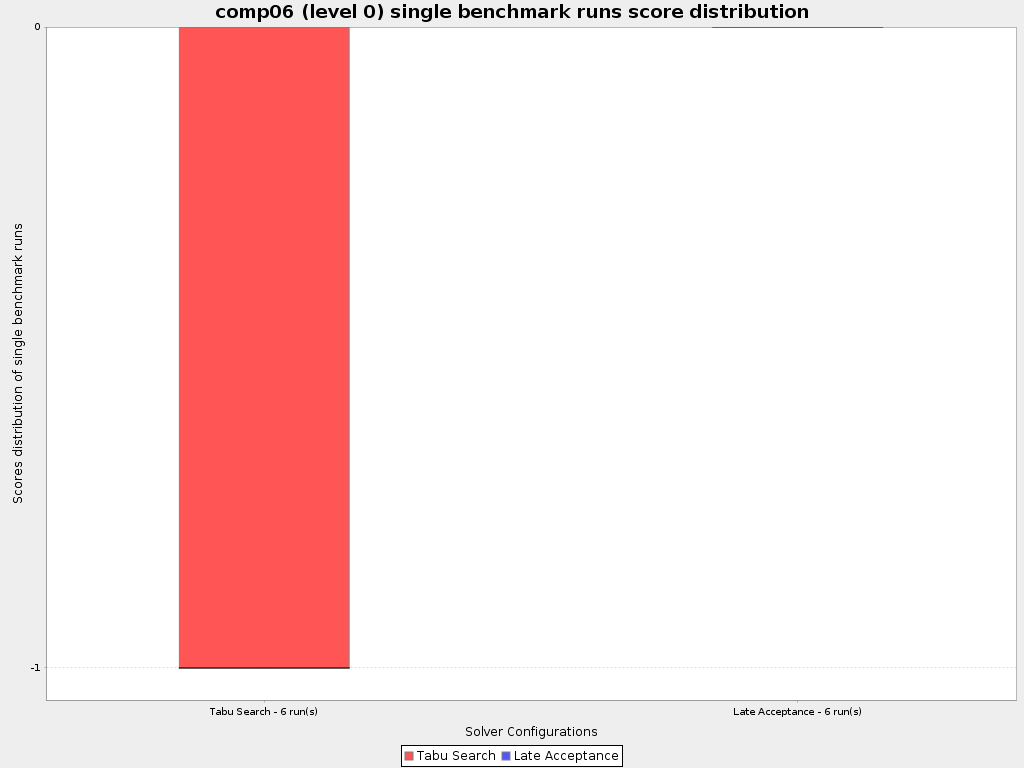
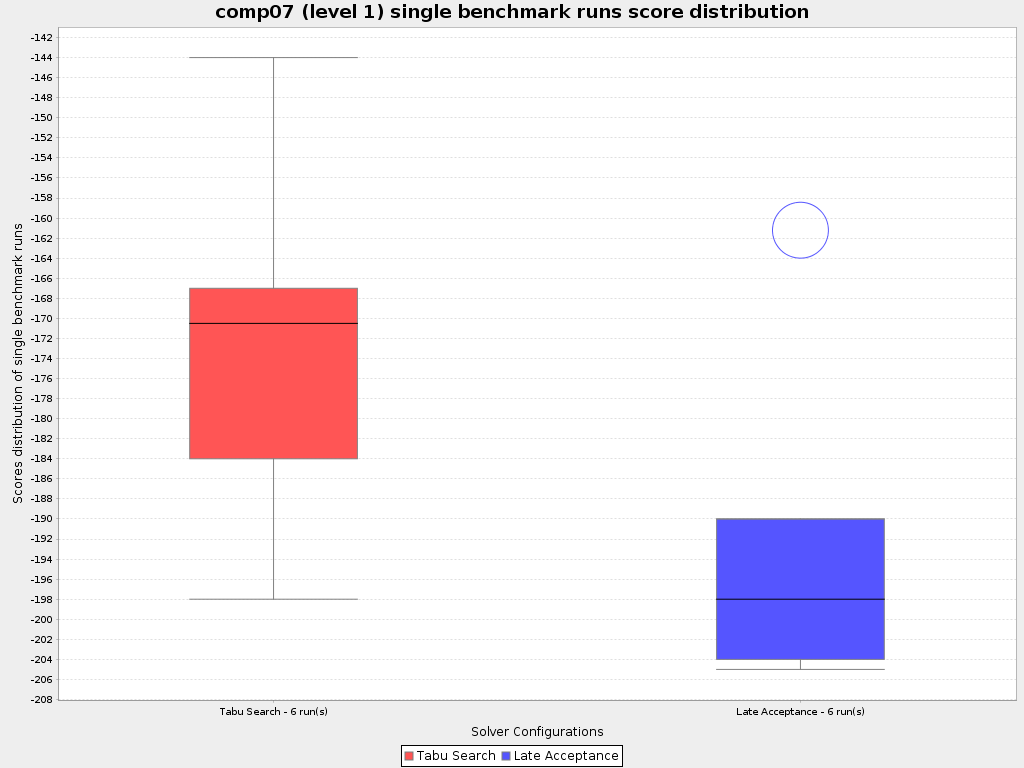
Result summary
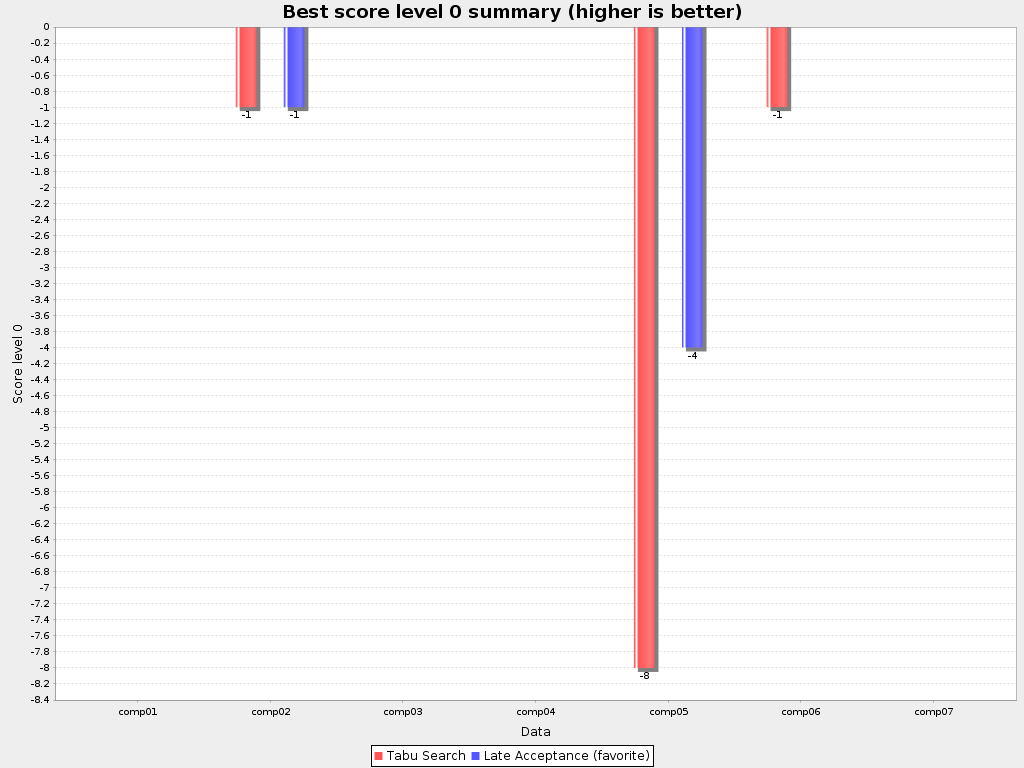
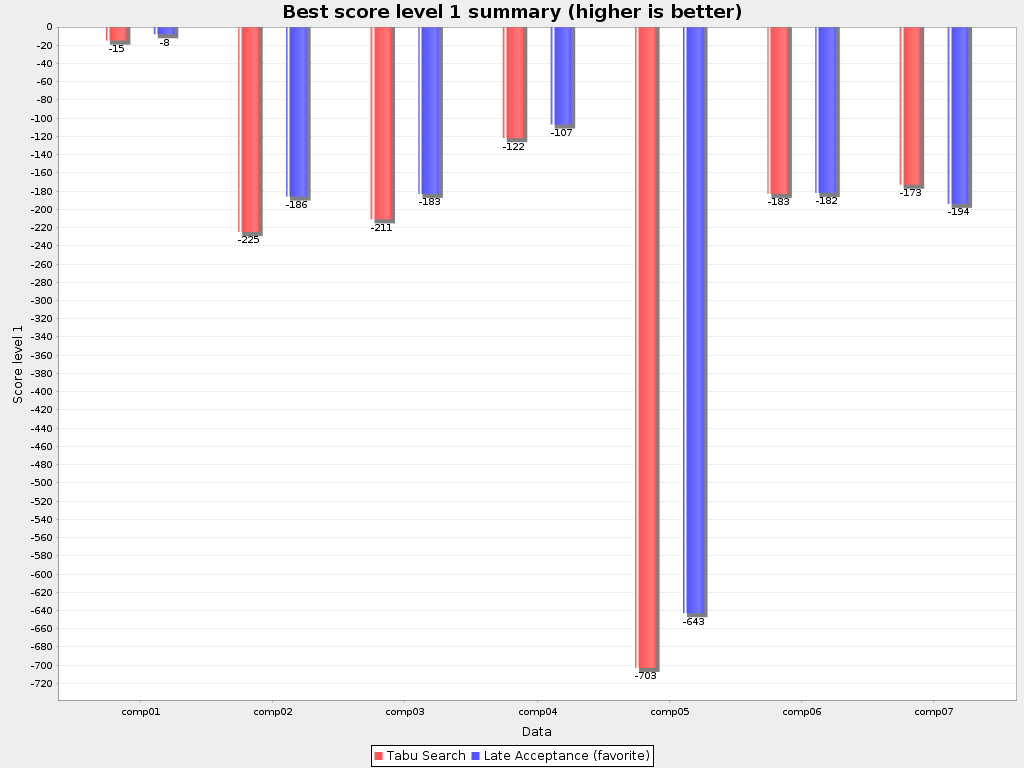
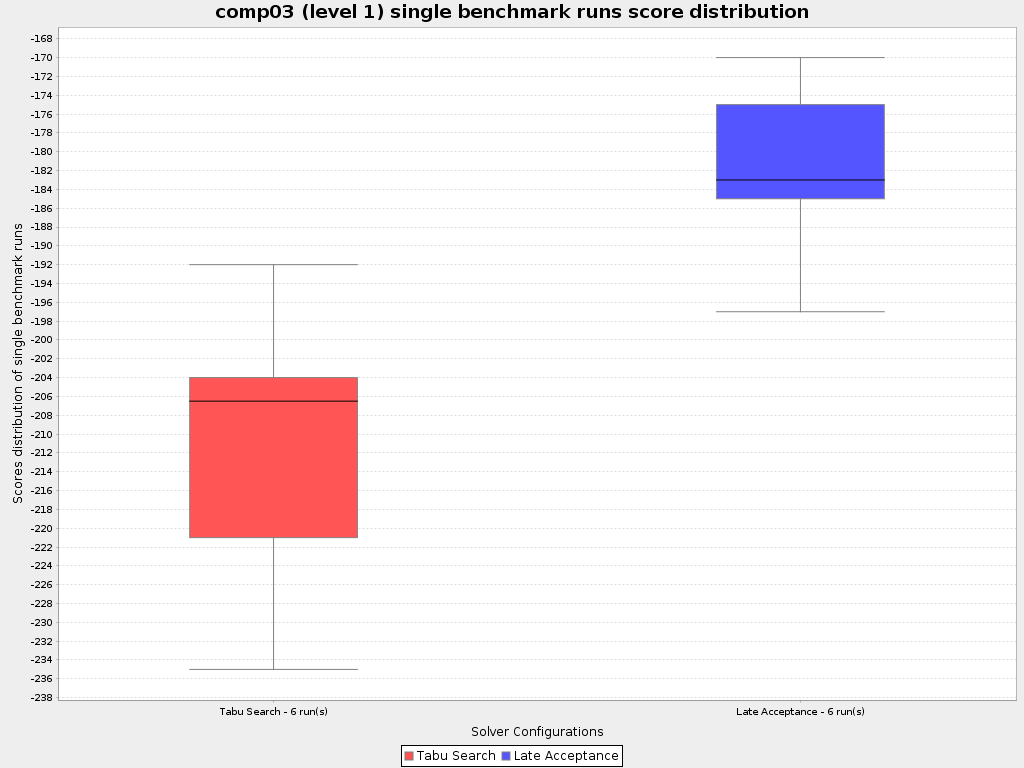
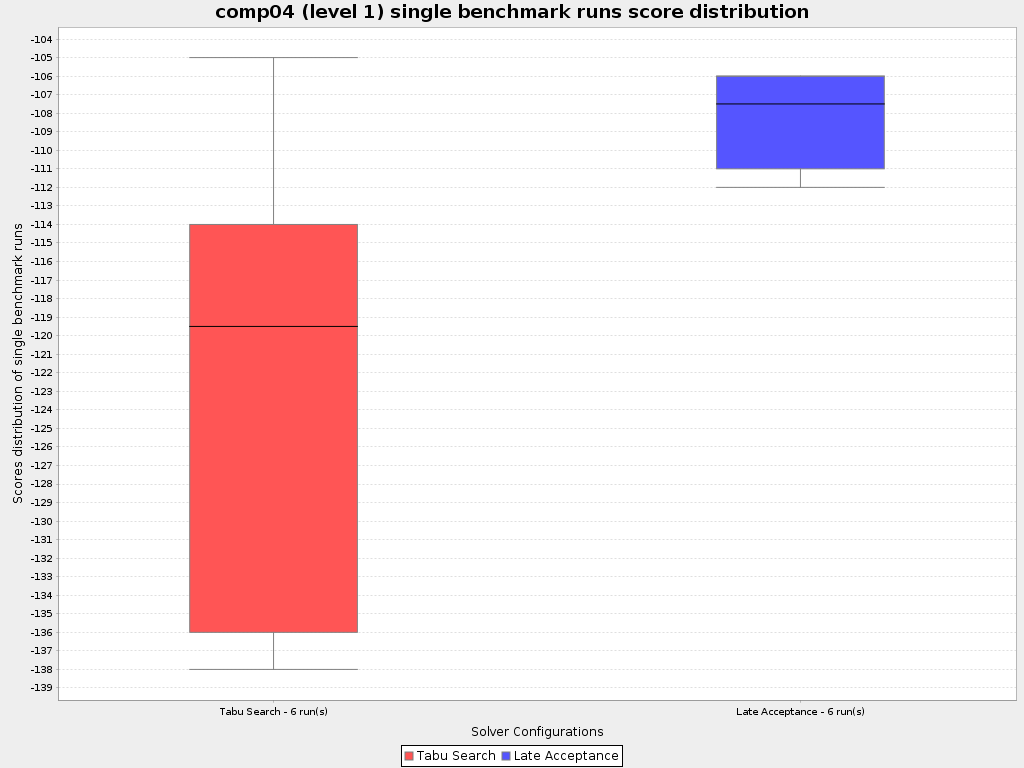
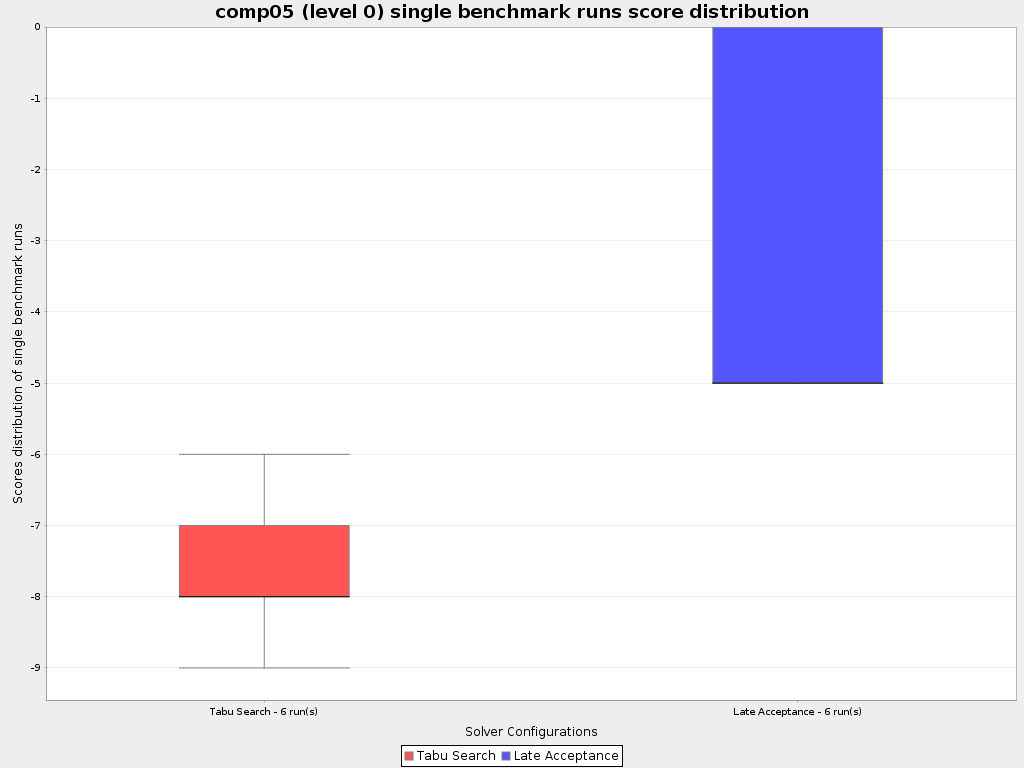
Best score summary
Useful for visualizing the best solver configuration.
| Solver | Total | Average | Standard Deviation | Problem | ||||||
|---|---|---|---|---|---|---|---|---|---|---|
| comp01 | comp02 | comp03 | comp04 | comp05 | comp06 | comp07 | ||||
| Tabu Search 1 ! | -10hard/-1632soft | -2hard/-234soft | 2.77/202.62 | |||||||
| Late Acceptance 0 ! | -5hard/-1503soft | -1hard/-215soft | 1.41/185.58 | |||||||
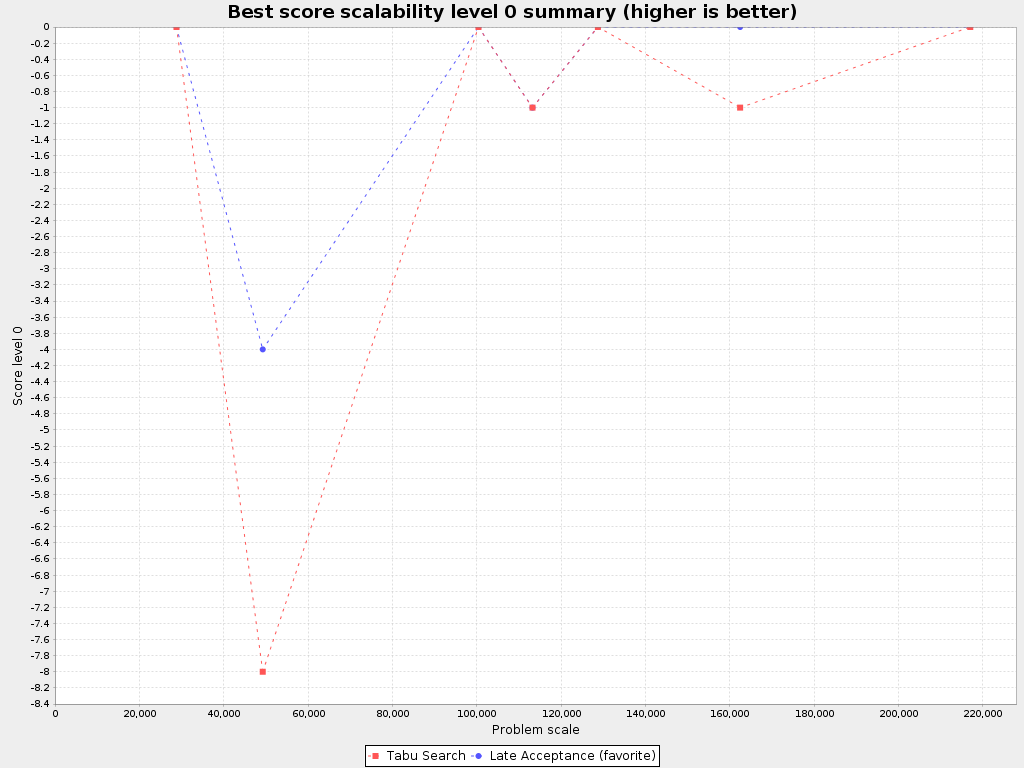
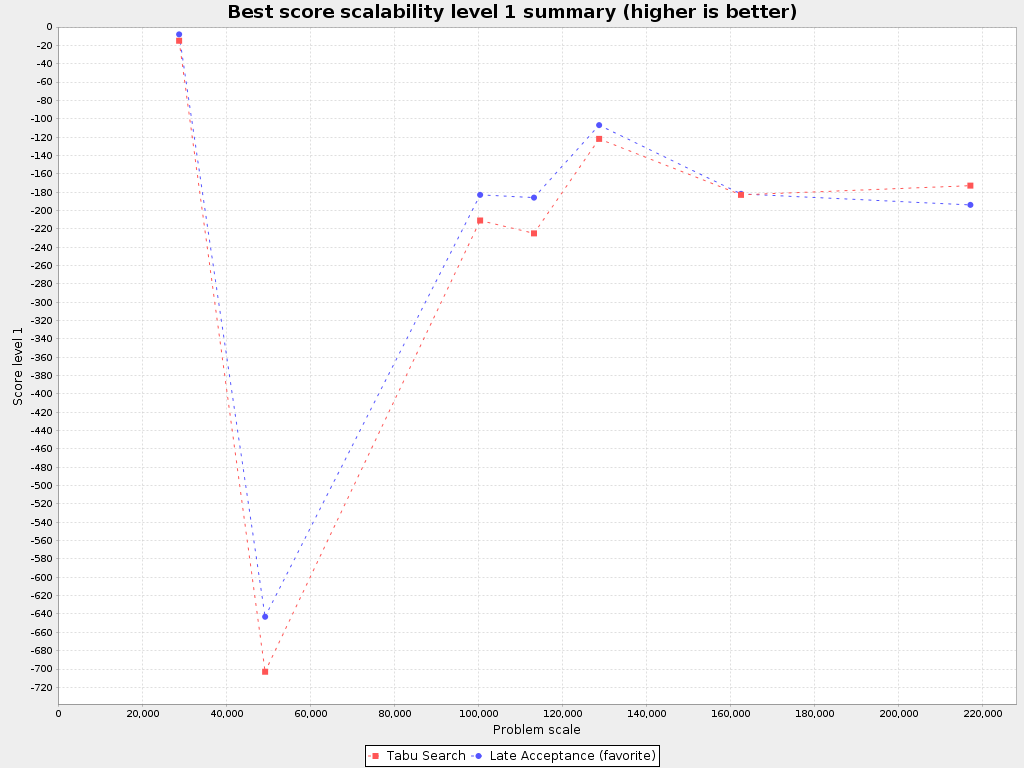
Best score scalability summary
Useful for visualizing the scalability of each solver configuration.
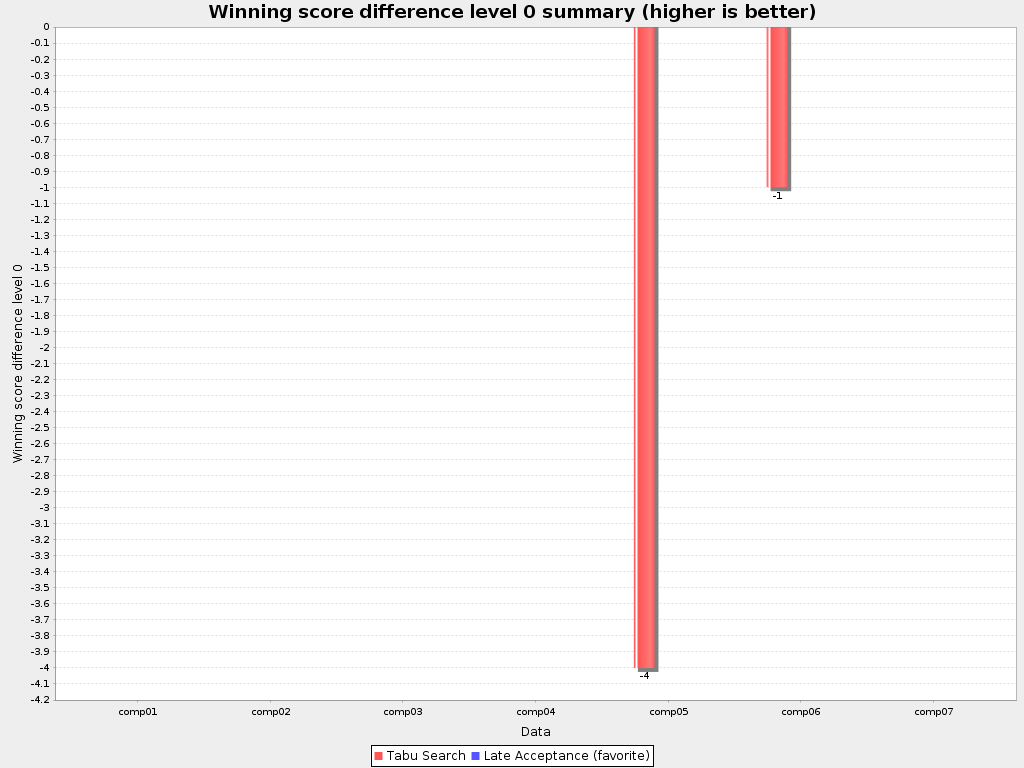
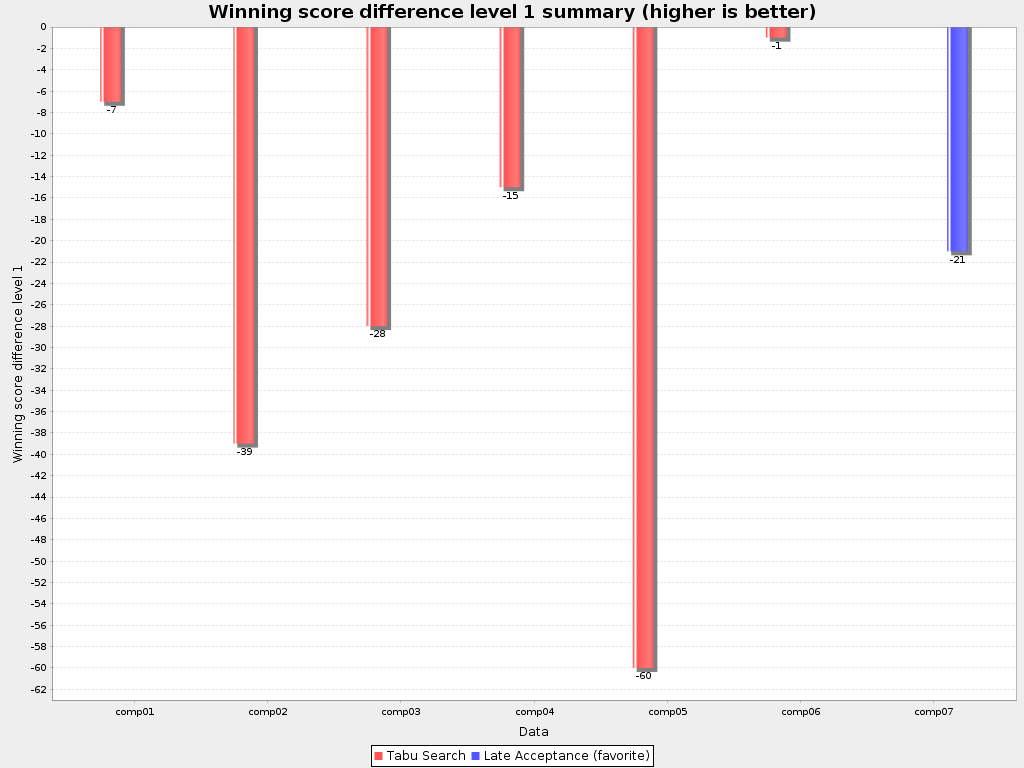
Winning score difference summary
Useful for zooming in on the results of the best score summary.
| Solver | Total | Average | Problem | ||||||
|---|---|---|---|---|---|---|---|---|---|
| comp01 | comp02 | comp03 | comp04 | comp05 | comp06 | comp07 | |||
| Tabu Search 1 ! | -5hard/-150soft | -1hard/-22soft | 0hard/-7soft 1 | 0hard/-39soft 1 ! | 0hard/-28soft 1 | 0hard/-15soft 1 | -4hard/-60soft 1 ! | -1hard/-1soft 1 ! | 0hard/0soft 0 |
| Late Acceptance 0 ! | 0hard/-21soft | 0hard/-3soft | 0hard/0soft 0 | 0hard/0soft 0 ! | 0hard/0soft 0 | 0hard/0soft 0 | 0hard/0soft 0 ! | 0hard/0soft 0 | 0hard/-21soft 1 |
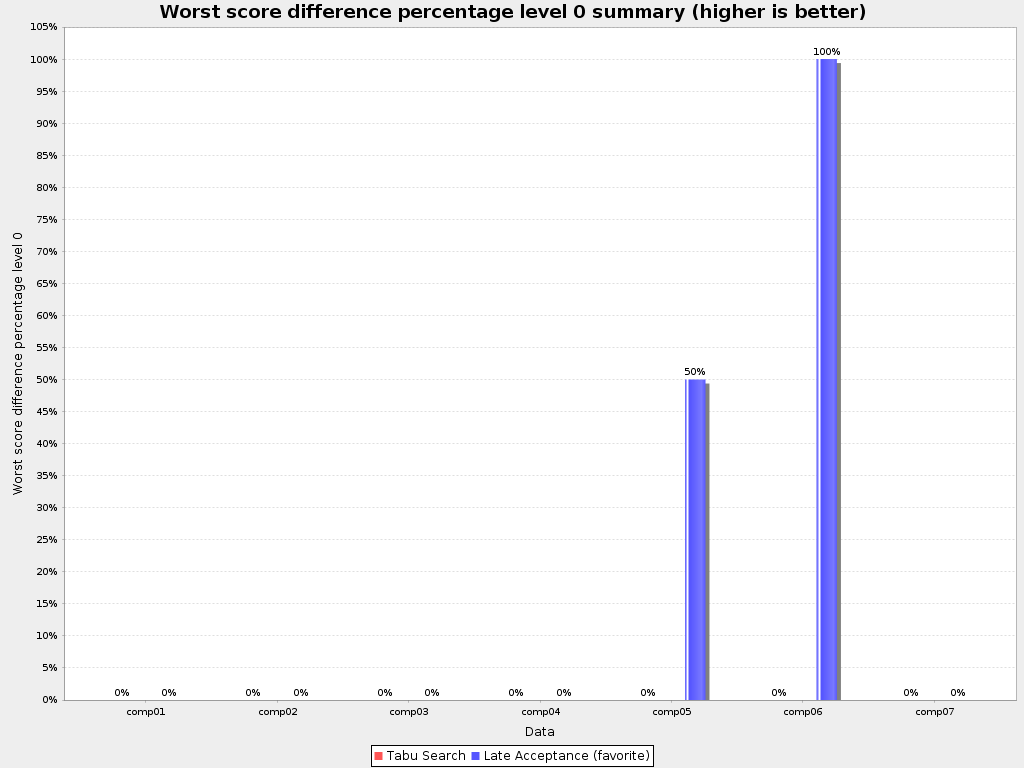
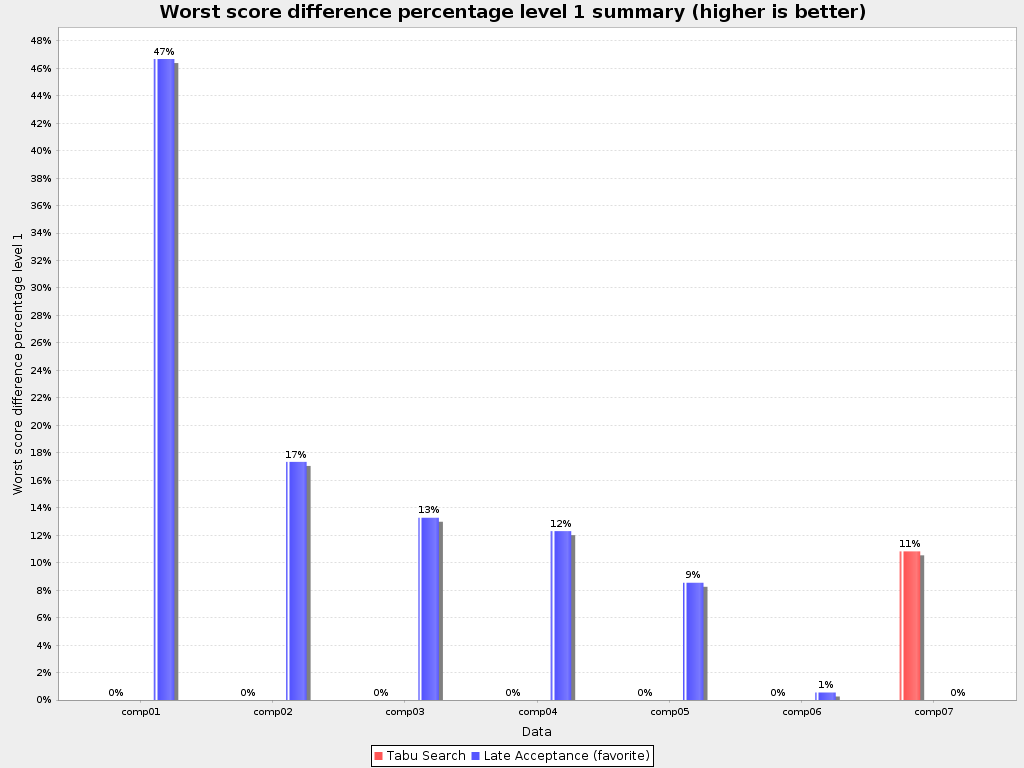
Worst score difference percentage summary (ROI)
Useful for visualizing the return on investment (ROI) to decision makers.
| Solver | Average | Problem | ||||||
|---|---|---|---|---|---|---|---|---|
| comp01 | comp02 | comp03 | comp04 | comp05 | comp06 | comp07 | ||
| Tabu Search 1 ! | 0.00%/1.55% | 0.00%/0.00% 1 | 0.00%/0.00% 1 ! | 0.00%/0.00% 1 | 0.00%/0.00% 1 | 0.00%/0.00% 1 ! | 0.00%/0.00% 1 ! | 0.00%/10.82% 0 |
| Late Acceptance 0 ! | 21.43%/14.09% | 0.00%/46.67% 0 | 0.00%/17.33% 0 ! | 0.00%/13.27% 0 | 0.00%/12.30% 0 | 50.00%/8.53% 0 ! | 100.00%/0.55% 0 | 0.00%/0.00% 1 |
Performance summary
Average calculate count summary
Useful for comparing different score calculators and/or score rule implementations (presuming that the solver configurations do not differ otherwise). Also useful to measure the scalability cost of an extra constraint.
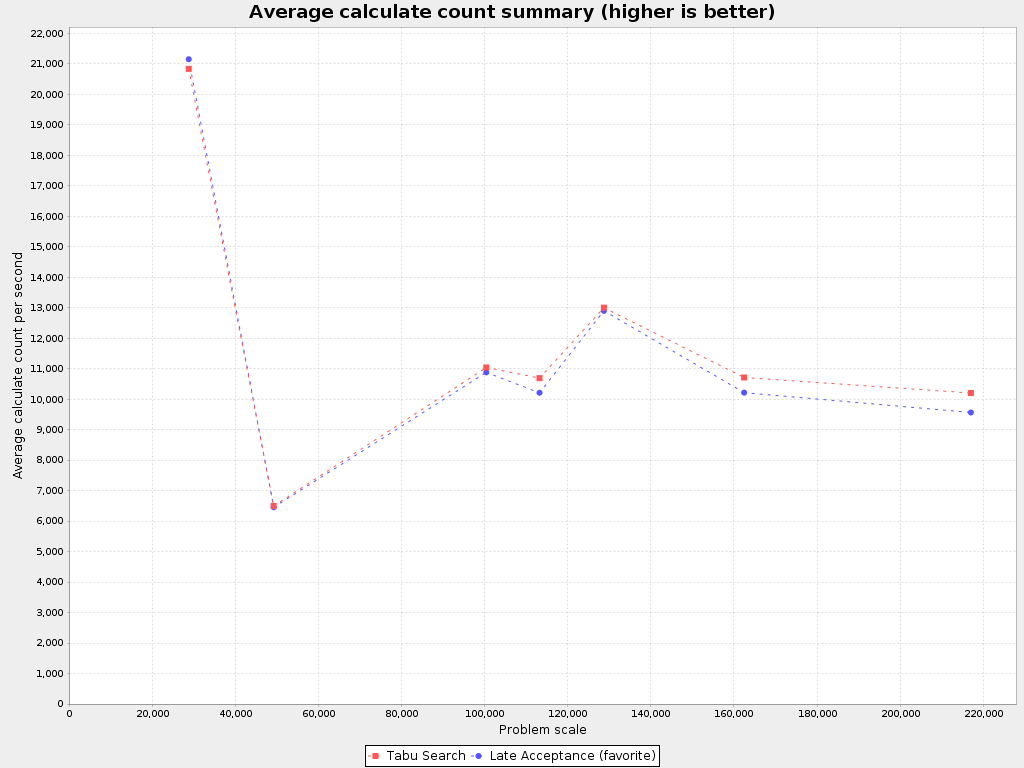
| Solver | Average | Problem | ||||||
|---|---|---|---|---|---|---|---|---|
| comp01 | comp02 | comp03 | comp04 | comp05 | comp06 | comp07 | ||
| Problem scale | 114,256 | 28,800 | 113,200 | 100,400 | 128,700 | 49,248 | 162,450 | 217,000 |
| Tabu Search 1 ! | 11,849/s | |||||||
| Late Acceptance 0 ! | 11,619/s | |||||||
Time spent summary
Useful for visualizing the performance of construction heuristics (presuming that no other solver phases are configured).
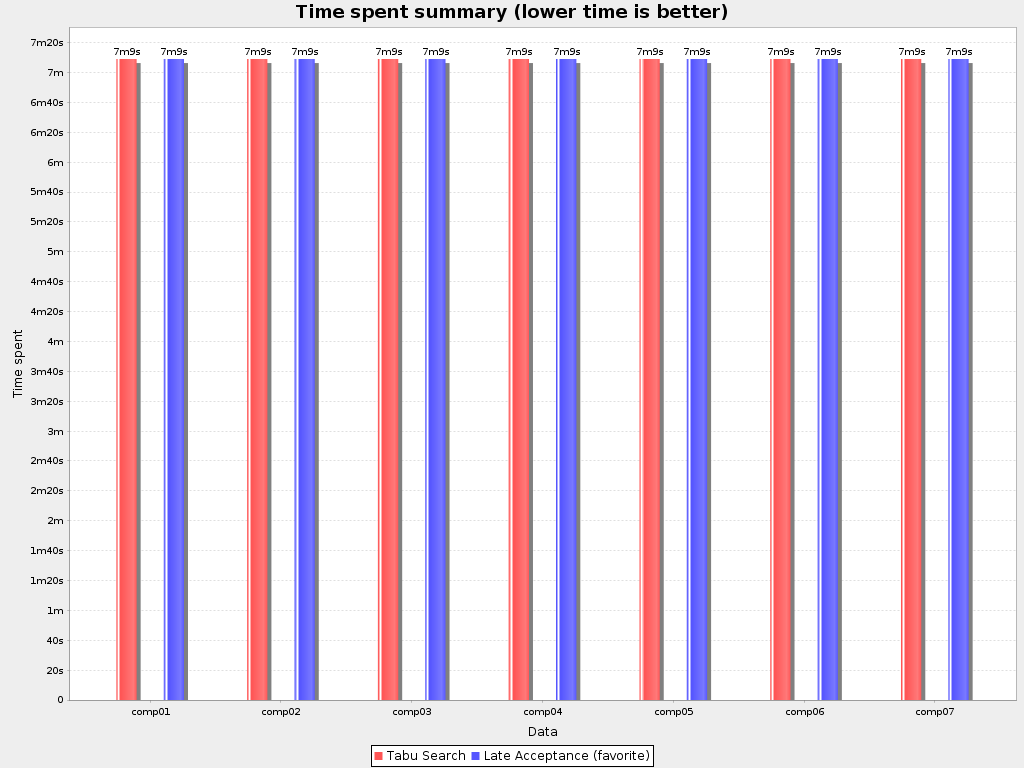
| Solver | Average | Problem | ||||||
|---|---|---|---|---|---|---|---|---|
| comp01 | comp02 | comp03 | comp04 | comp05 | comp06 | comp07 | ||
| Problem scale | 114,256 | 28,800 | 113,200 | 100,400 | 128,700 | 49,248 | 162,450 | 217,000 |
| Tabu Search 1 ! | 429,000 | |||||||
| Late Acceptance 0 ! | 429,000 | |||||||
Time spent scalability summary
Useful for extrapolating the scalability of construction heuristics (presuming that no other solver phases are configured).
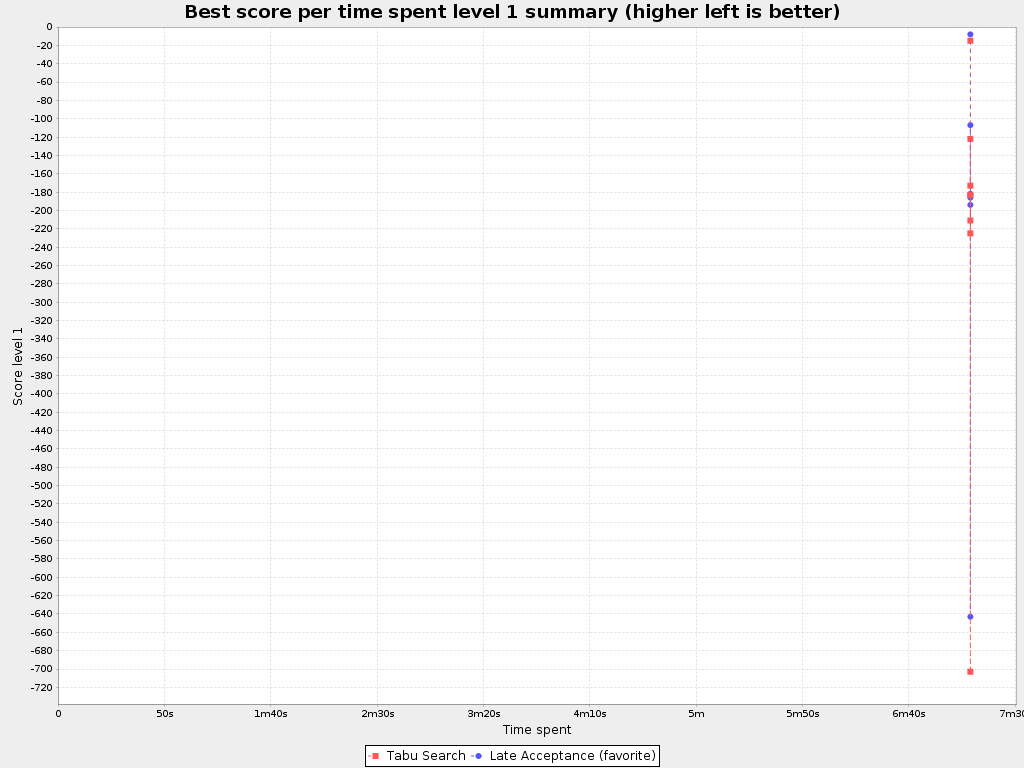
Best score per time spent summary
Useful for visualizing trade-off between the best score versus the time spent for construction heuristics (presuming that no other solver phases are configured).
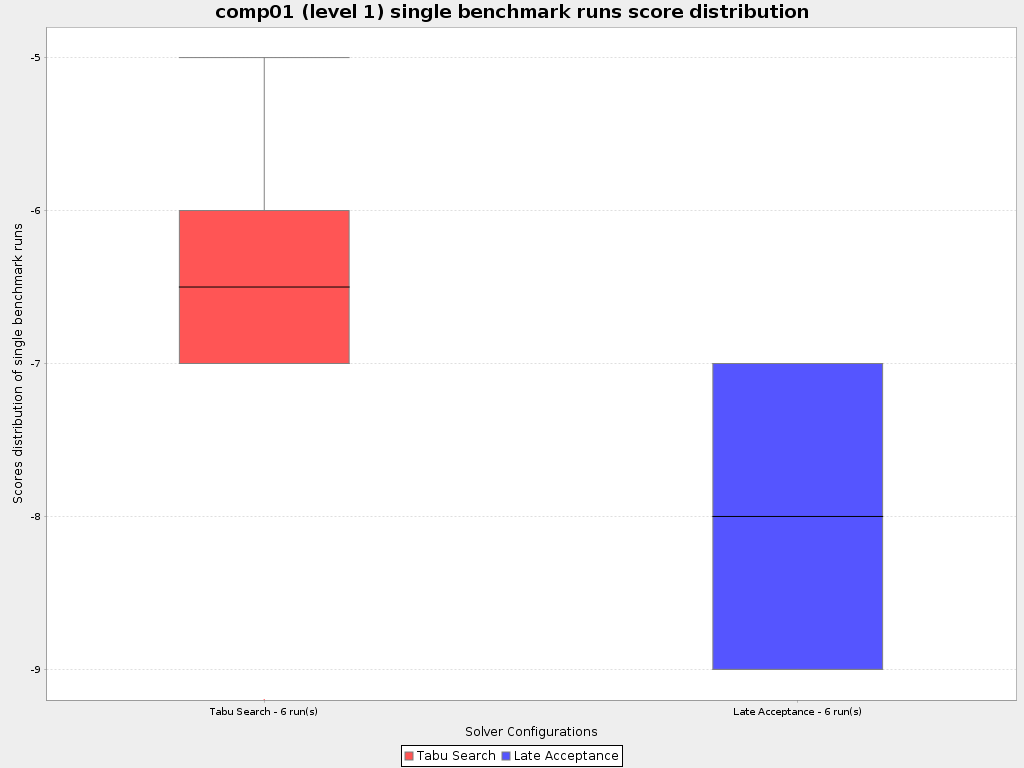
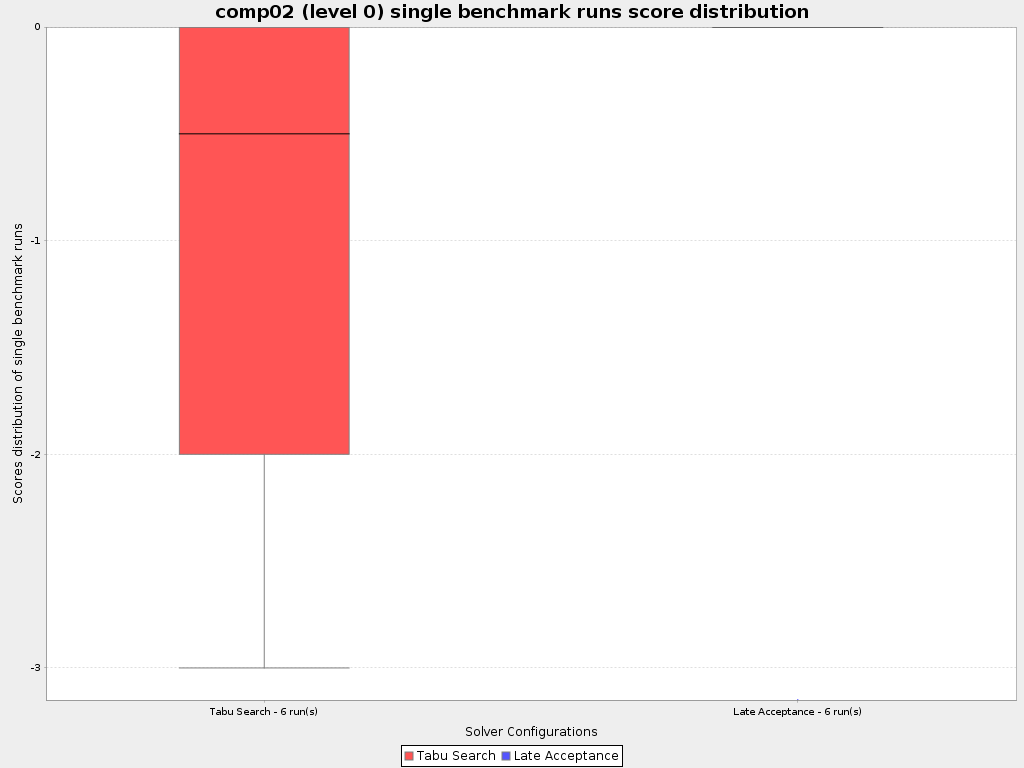
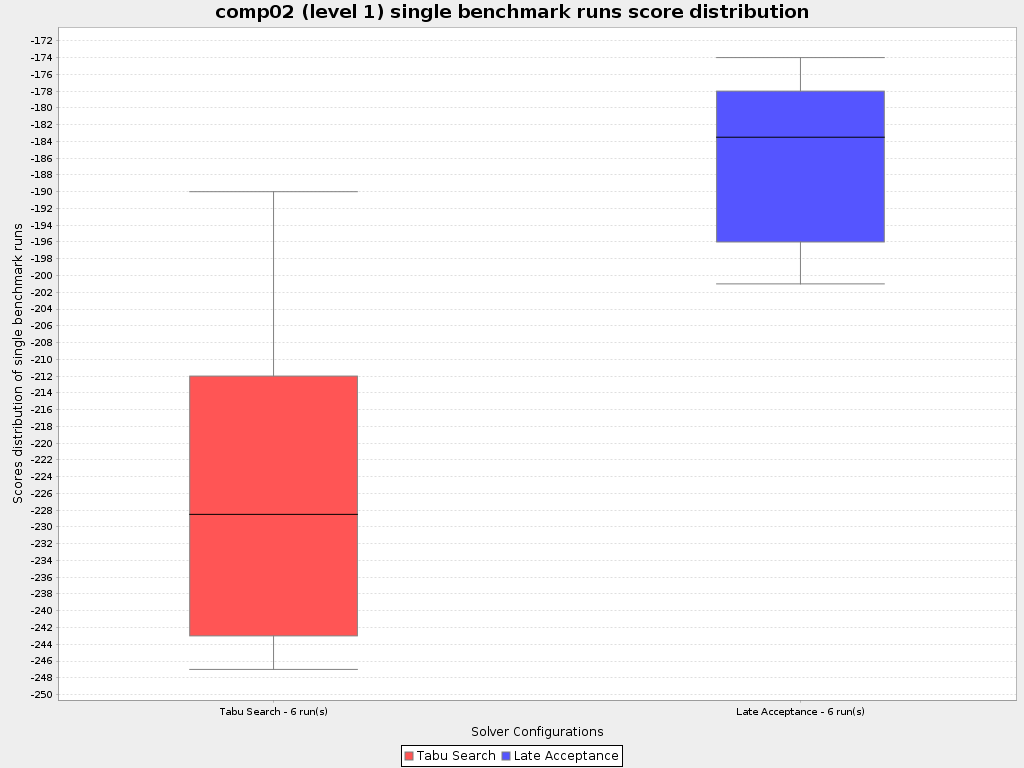
Problem benchmarks
comp01
Entity count: 160
Variable count: 320
Problem scale: 28,800
Memory usage after loading the inputSolution (before creating the Solver): 14,303,220 bytes on average.

comp02
Entity count: 283
Variable count: 566
Problem scale: 113,200
Memory usage after loading the inputSolution (before creating the Solver): 14,102,348 bytes on average.
comp03
Entity count: 251
Variable count: 502
Problem scale: 100,400
Memory usage after loading the inputSolution (before creating the Solver): 13,762,884 bytes on average.
comp04
Entity count: 286
Variable count: 572
Problem scale: 128,700
Memory usage after loading the inputSolution (before creating the Solver): 13,773,604 bytes on average.

comp05
Entity count: 152
Variable count: 304
Problem scale: 49,248
Memory usage after loading the inputSolution (before creating the Solver): 13,791,292 bytes on average.
comp06
Entity count: 361
Variable count: 722
Problem scale: 162,450
Memory usage after loading the inputSolution (before creating the Solver): 13,809,072 bytes on average.

comp07
Entity count: 434
Variable count: 868
Problem scale: 217,000
Memory usage after loading the inputSolution (before creating the Solver): 13,826,600 bytes on average.

Solver benchmarks
Tabu Search 1 !
<solver>
  <environmentMode>PRODUCTION</environmentMode>
  <solutionClass>org.optaplanner.examples.curriculumcourse.domain.CourseSchedule</solutionClass>
  <entityClass>org.optaplanner.examples.curriculumcourse.domain.Lecture</entityClass>
  <scoreDirectorFactory>
    <scoreDefinitionType>HARD_SOFT</scoreDefinitionType>
    <scoreDrl>org/optaplanner/examples/curriculumcourse/solver/curriculumCourseScoreRules.drl</scoreDrl>
  </scoreDirectorFactory>
  <termination>
    <secondsSpentLimit>429</secondsSpentLimit>
  </termination>
  <constructionHeuristic>
    <constructionHeuristicType>FIRST_FIT_DECREASING</constructionHeuristicType>
  </constructionHeuristic>
  <localSearch>
    <unionMoveSelector>
      <changeMoveSelector/>
      <swapMoveSelector>
        <filterClass>org.optaplanner.examples.curriculumcourse.solver.move.DifferentCourseSwapMoveFilter</filterClass>
      </swapMoveSelector>
    </unionMoveSelector>
    <acceptor>
      <entityTabuSize>9</entityTabuSize>
    </acceptor>
    <forager>
      <acceptedCountLimit>900</acceptedCountLimit>
    </forager>
  </localSearch>
</solver>
Late Acceptance 0 !
<solver>
  <environmentMode>PRODUCTION</environmentMode>
  <solutionClass>org.optaplanner.examples.curriculumcourse.domain.CourseSchedule</solutionClass>
  <entityClass>org.optaplanner.examples.curriculumcourse.domain.Lecture</entityClass>
  <scoreDirectorFactory>
    <scoreDefinitionType>HARD_SOFT</scoreDefinitionType>
    <scoreDrl>org/optaplanner/examples/curriculumcourse/solver/curriculumCourseScoreRules.drl</scoreDrl>
  </scoreDirectorFactory>
  <termination>
    <secondsSpentLimit>429</secondsSpentLimit>
  </termination>
  <constructionHeuristic>
    <constructionHeuristicType>FIRST_FIT_DECREASING</constructionHeuristicType>
  </constructionHeuristic>
  <localSearch>
    <unionMoveSelector>
      <changeMoveSelector/>
      <swapMoveSelector>
        <filterClass>org.optaplanner.examples.curriculumcourse.solver.move.DifferentCourseSwapMoveFilter</filterClass>
      </swapMoveSelector>
    </unionMoveSelector>
    <acceptor>
      <lateAcceptanceSize>600</lateAcceptanceSize>
    </acceptor>
    <forager>
      <acceptedCountLimit>4</acceptedCountLimit>
    </forager>
  </localSearch>
</solver>
Benchmark information
| Name | 2015-09-27_215336 |
|---|---|
| Aggregation | false |
| Failure count | 0 |
| Starting timestamp | Sep 27, 2015 9:53:36 PM |
| Warm up time spent | 30,000 ms |
| Parallel benchmark count / available processors | 1 / 8 |
| Benchmark time spent | 36,083,574 ms |
| Environment mode | PRODUCTION |
| Logging level | debug |
| Solver ranking class | TotalScoreSolverRankingComparator |
| VM max memory (as in -Xmx but lower) | 7,635,730,432 bytes |
| OptaPlanner version | Unjarred development snapshot |
| Java version | Java 1.7.0_79 (Oracle Corporation) |
| Java VM | Java Java HotSpot(TM) 64-Bit Server VM 24.79-b02 (Oracle Corporation) |
| Operating system | Linux amd64 4.1.7-200.fc22.x86_64 |
| Report locale | en_US |