
Benchmark report
Summary
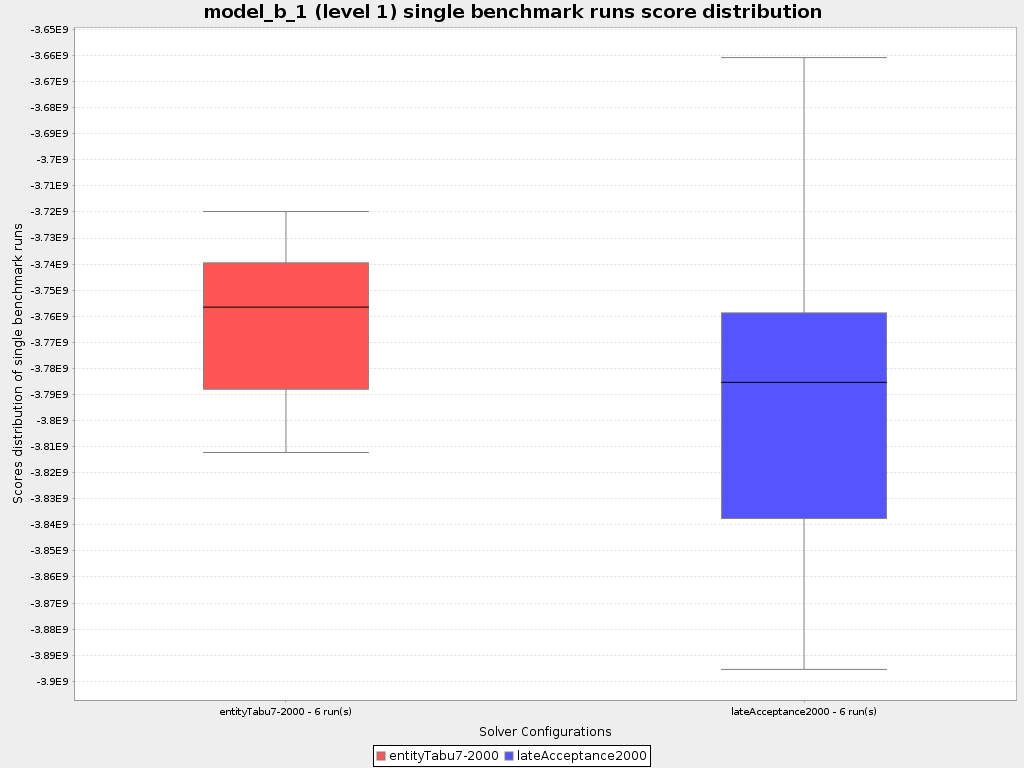
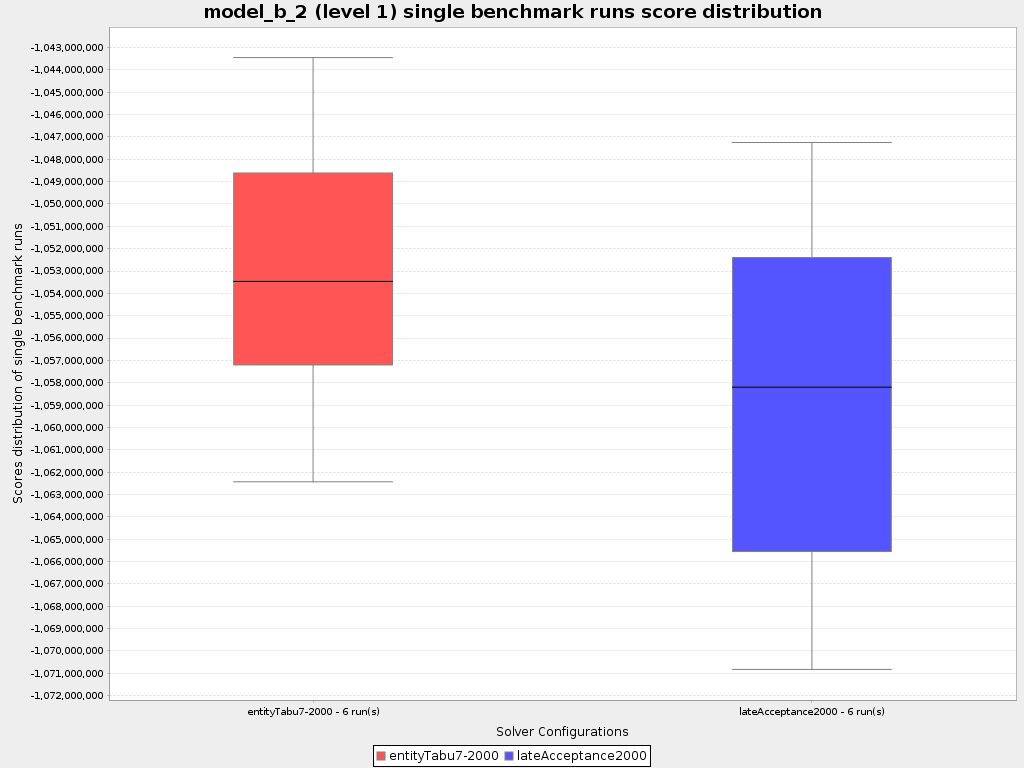
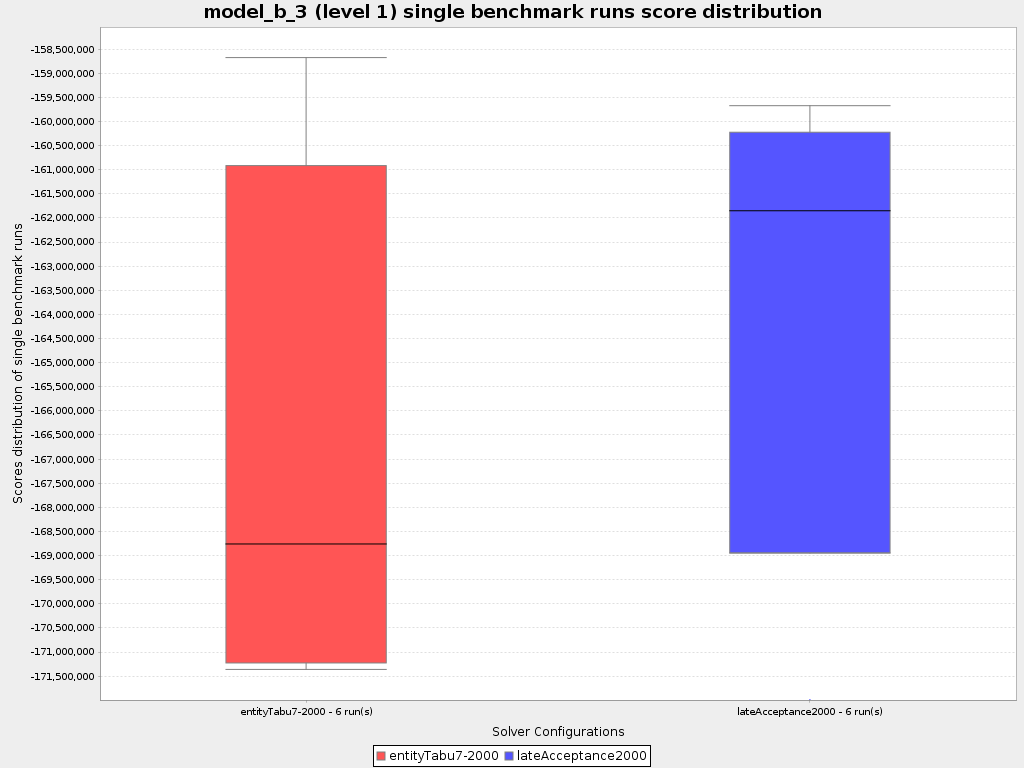
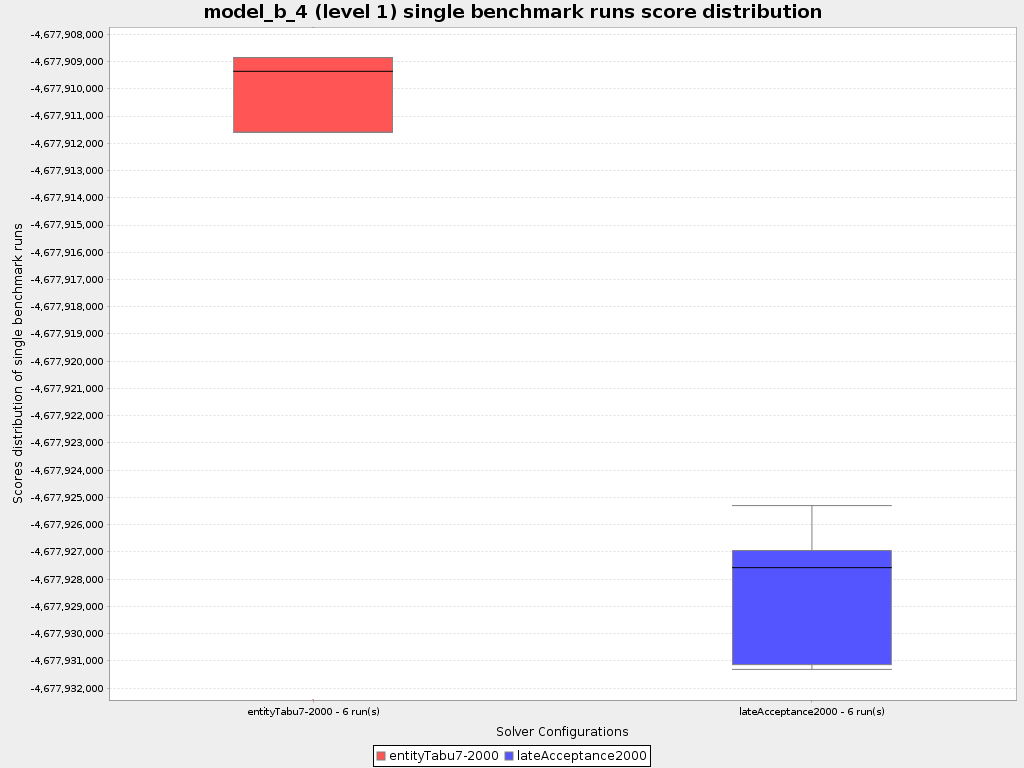
Result summary
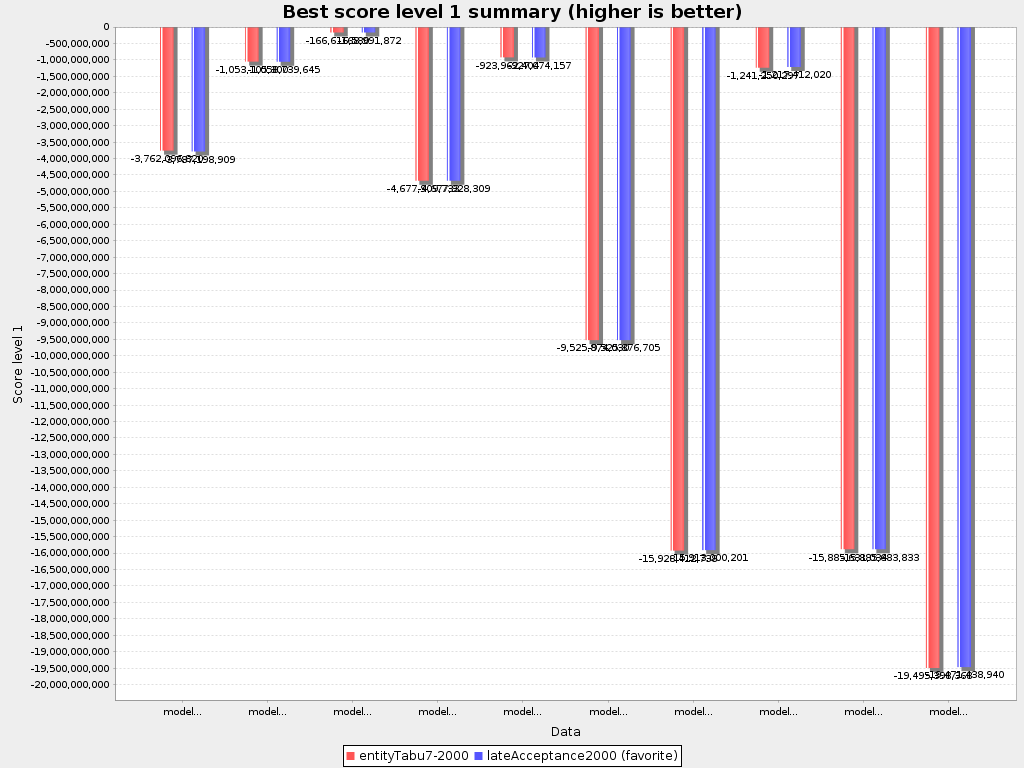
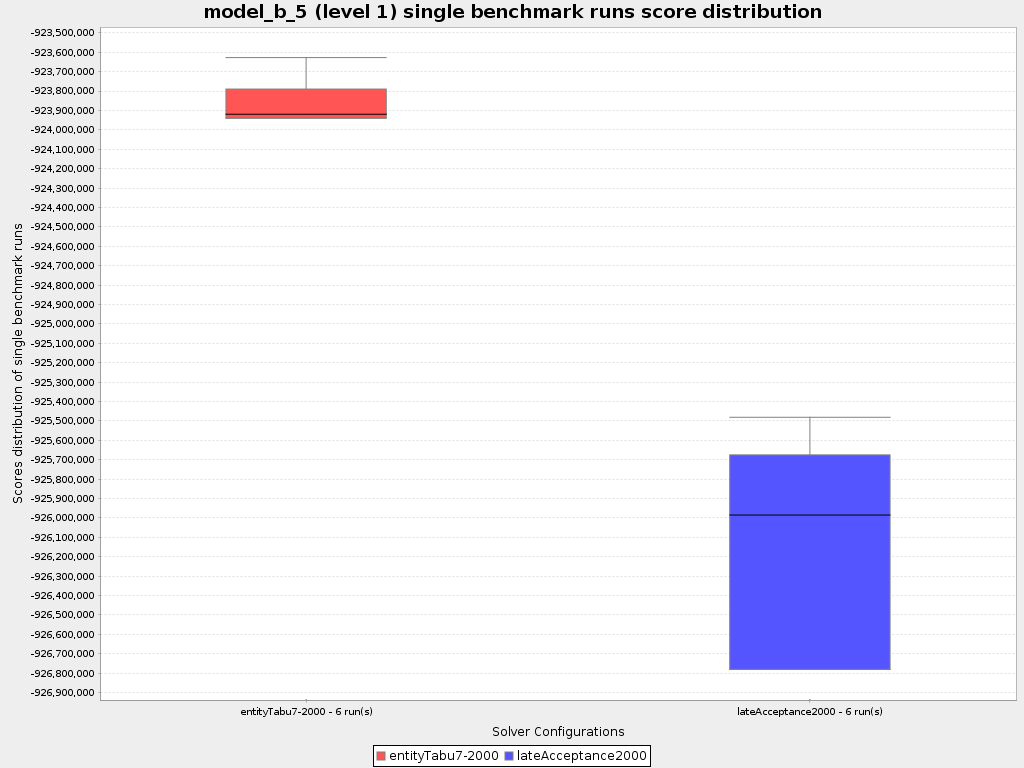
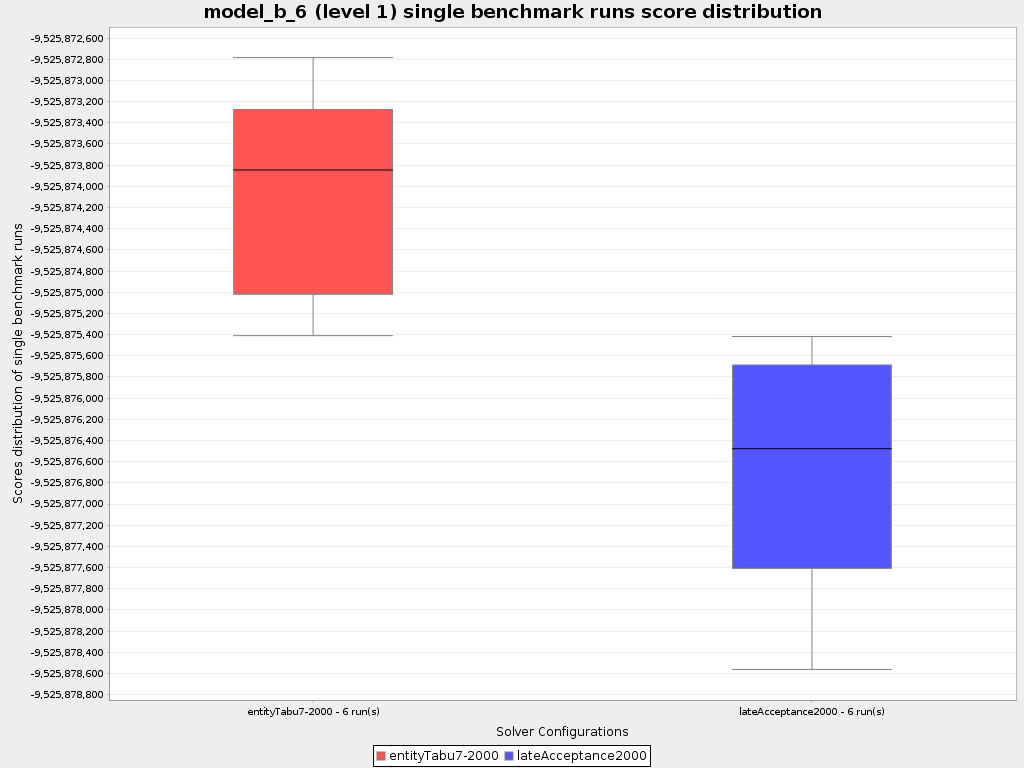
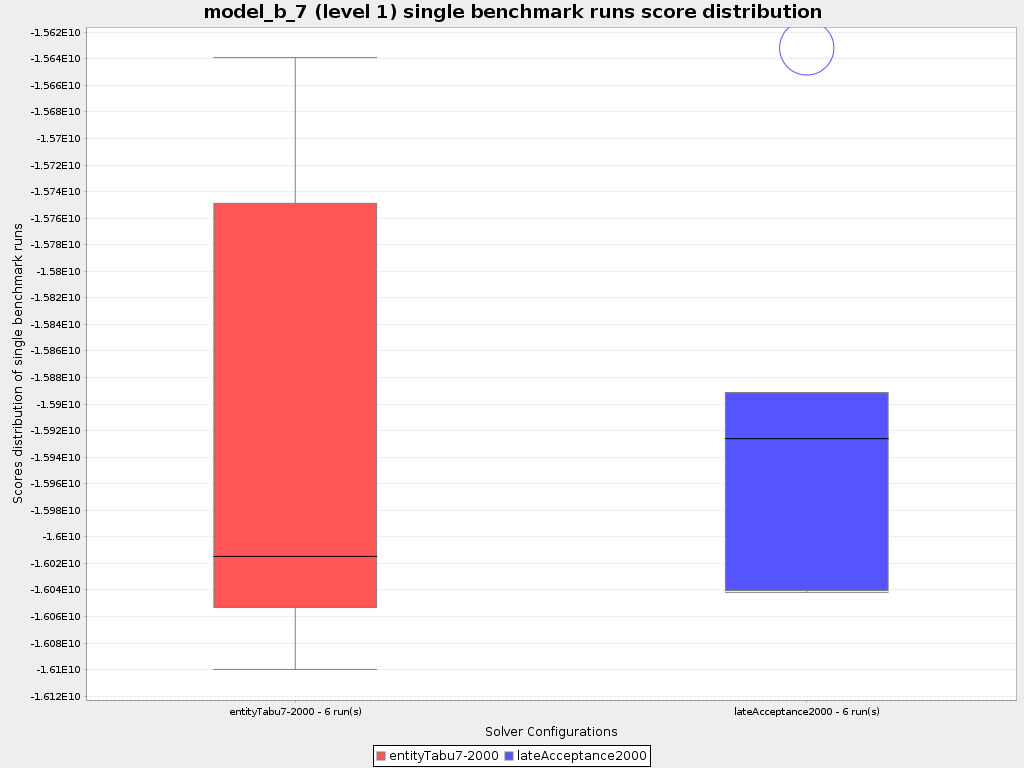
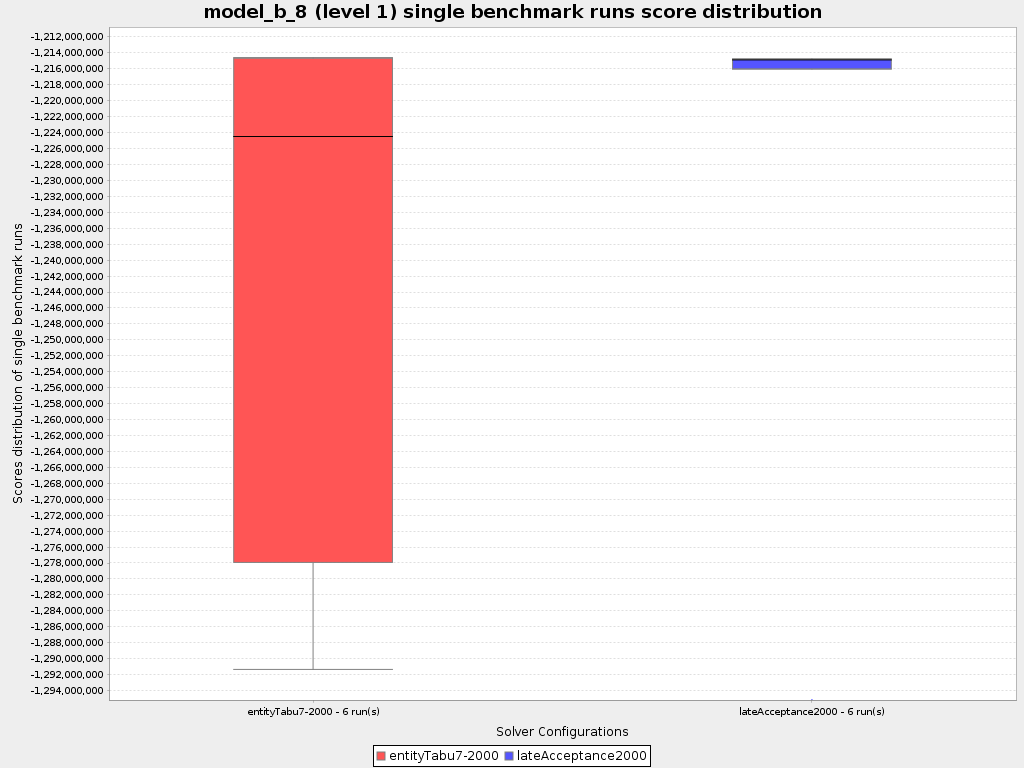
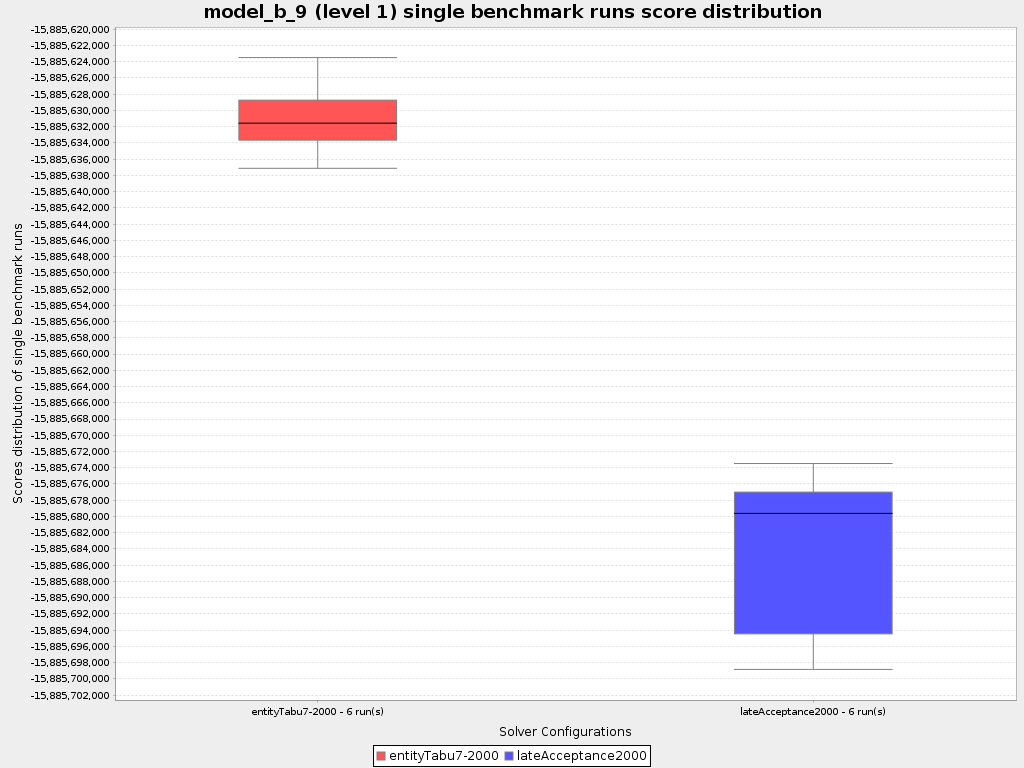
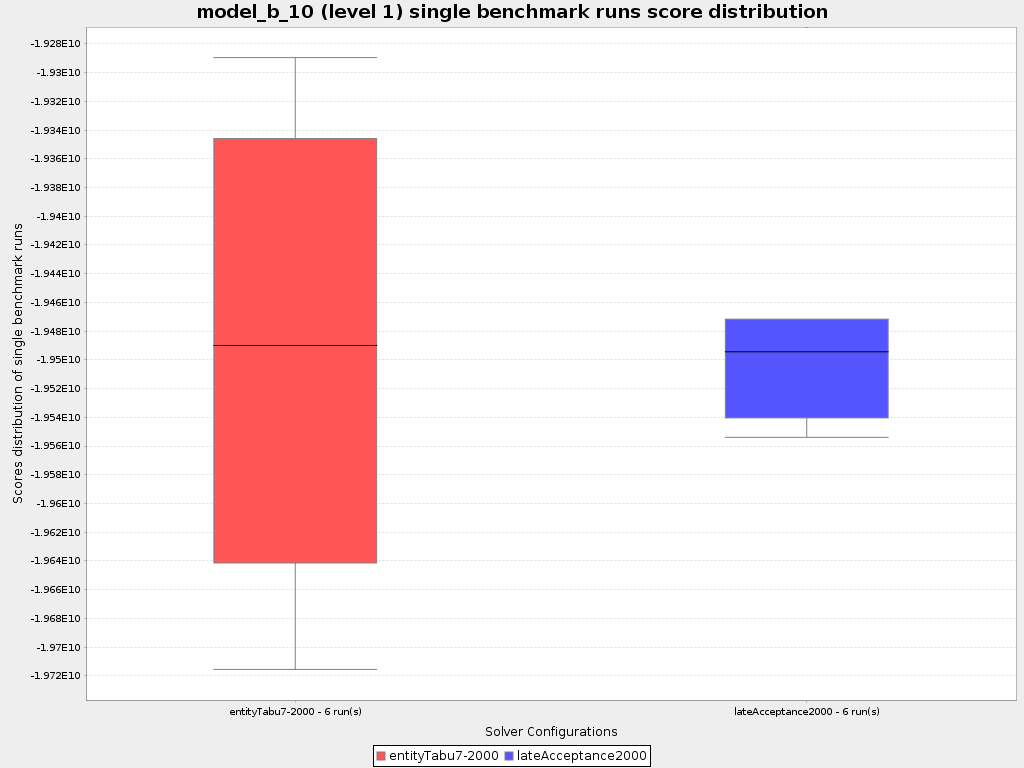
Best score summary
Useful for visualizing the best solver configuration.
| Solver | Total | Average | Standard Deviation | Problem | |||||||||
|---|---|---|---|---|---|---|---|---|---|---|---|---|---|
| model_b_1 | model_b_2 | model_b_3 | model_b_4 | model_b_5 | model_b_6 | model_b_7 | model_b_8 | model_b_9 | model_b_10 | ||||
| entityTabu7-2000 1 | 0hard/-72660257304soft | 0hard/-7266025731soft | 0.0/6.98 | ||||||||||
| lateAcceptance2000 0 | 0hard/-72633344591soft | 0hard/-7263334460soft | 0.0/6.98 | ||||||||||
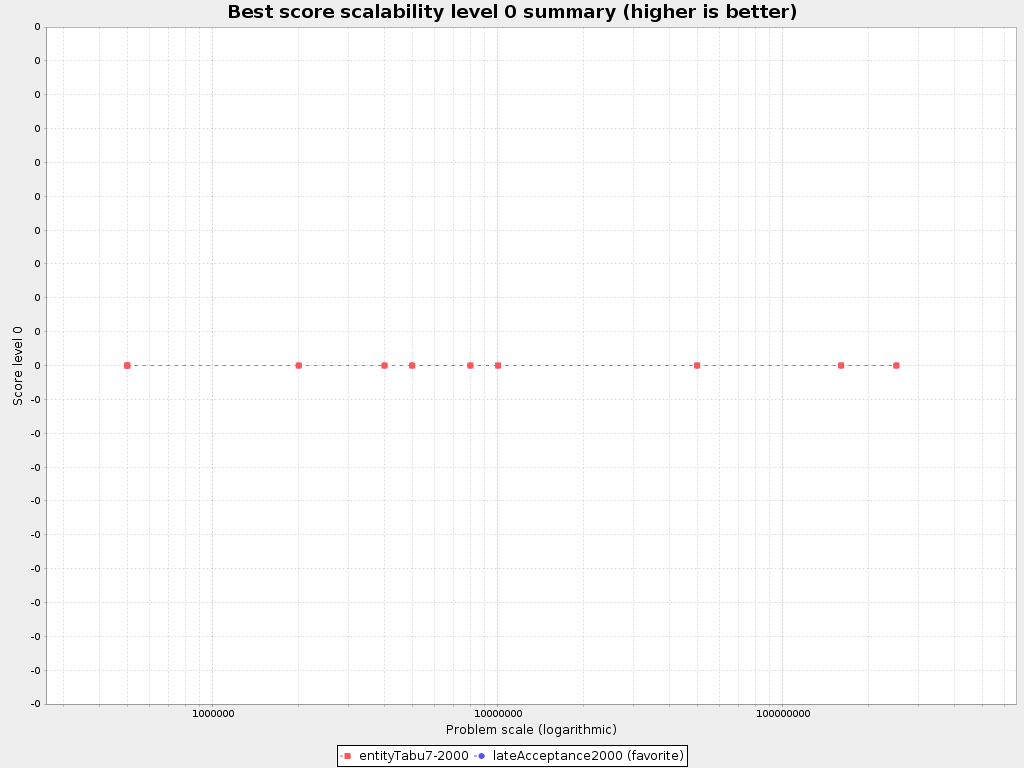
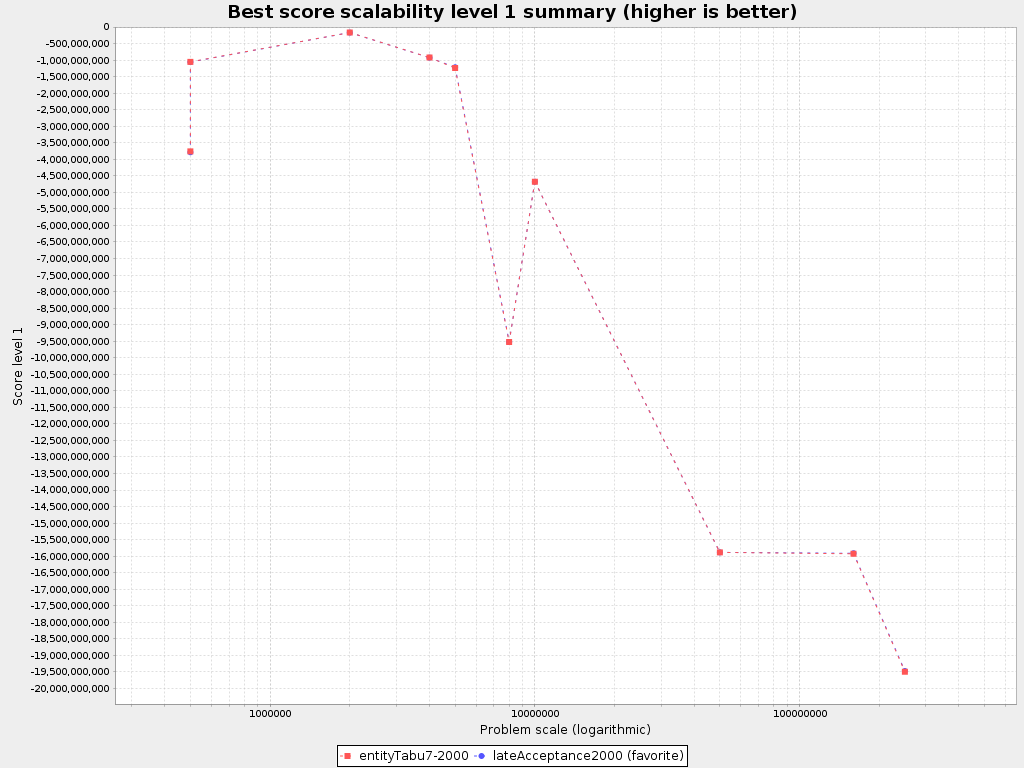
Best score scalability summary
Useful for visualizing the scalability of each solver configuration.
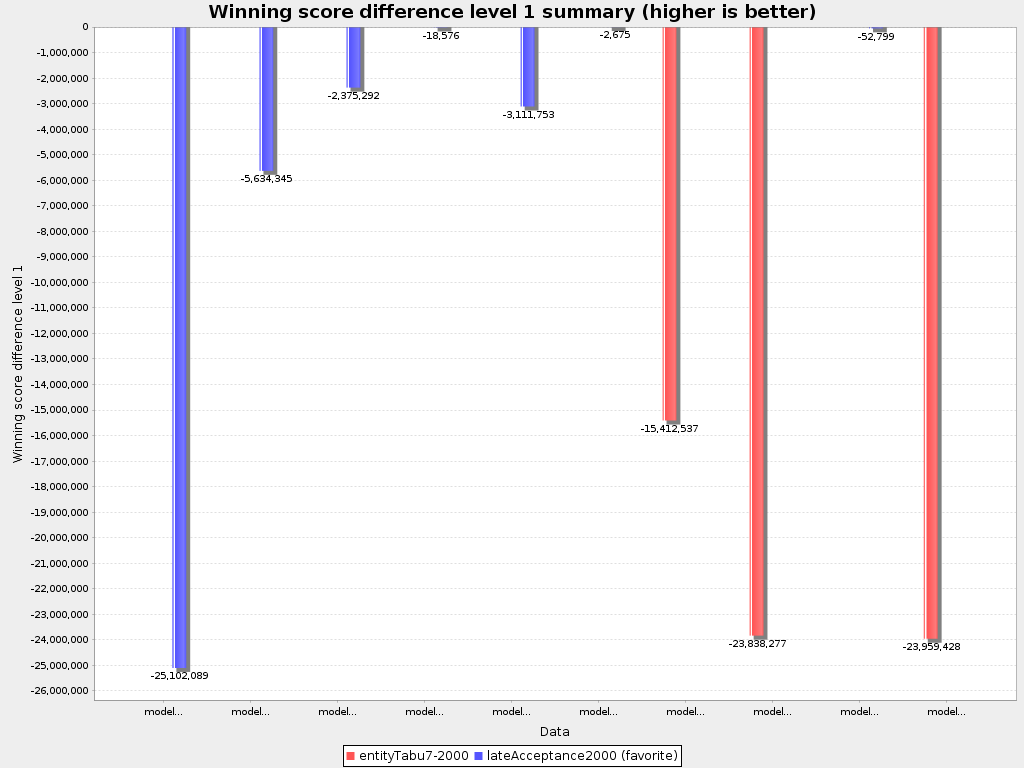
Winning score difference summary
Useful for zooming in on the results of the best score summary.
| Solver | Total | Average | Problem | |||||||||
|---|---|---|---|---|---|---|---|---|---|---|---|---|
| model_b_1 | model_b_2 | model_b_3 | model_b_4 | model_b_5 | model_b_6 | model_b_7 | model_b_8 | model_b_9 | model_b_10 | |||
| entityTabu7-2000 1 | 0hard/-63210242soft | 0hard/-6321025soft | 0hard/0soft 0 | 0hard/0soft 0 | 0hard/0soft 0 | 0hard/0soft 0 | 0hard/0soft 0 | 0hard/0soft 0 | 0hard/-15412537soft 1 | 0hard/-23838277soft 1 | 0hard/0soft 0 | 0hard/-23959428soft 1 |
| lateAcceptance2000 0 | 0hard/-36297529soft | 0hard/-3629753soft | 0hard/-25102089soft 1 | 0hard/-5634345soft 1 | 0hard/-2375292soft 1 | 0hard/-18576soft 1 | 0hard/-3111753soft 1 | 0hard/-2675soft 1 | 0hard/0soft 0 | 0hard/0soft 0 | 0hard/-52799soft 1 | 0hard/0soft 0 |
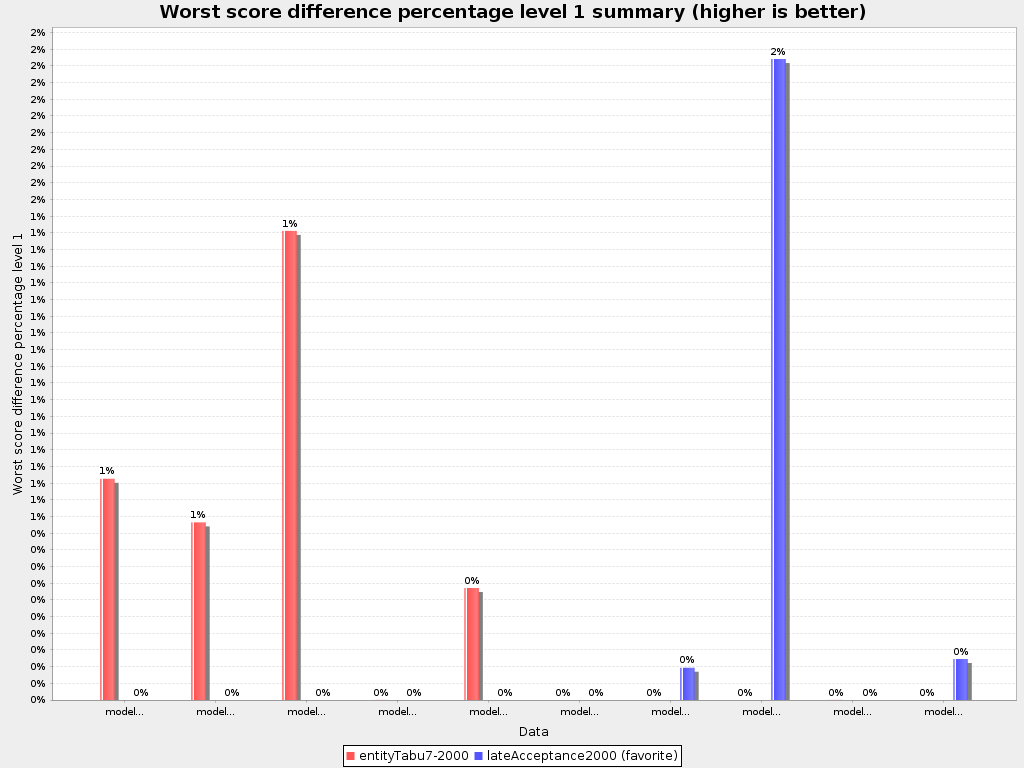
Worst score difference percentage summary (ROI)
Useful for visualizing the return on investment (ROI) to decision makers.

| Solver | Average | Problem | |||||||||
|---|---|---|---|---|---|---|---|---|---|---|---|
| model_b_1 | model_b_2 | model_b_3 | model_b_4 | model_b_5 | model_b_6 | model_b_7 | model_b_8 | model_b_9 | model_b_10 | ||
| entityTabu7-2000 1 | 0.00%/0.29% | 0.00%/0.66% 0 | 0.00%/0.53% 0 | 0.00%/1.41% 0 | 0.00%/0.00% 0 | 0.00%/0.34% 0 | 0.00%/0.00% 0 | 0.00%/0.00% 1 | 0.00%/0.00% 1 | 0.00%/0.00% 0 | 0.00%/0.00% 1 |
| lateAcceptance2000 0 | 0.00%/0.21% | 0.00%/0.00% 1 | 0.00%/0.00% 1 | 0.00%/0.00% 1 | 0.00%/0.00% 1 | 0.00%/0.00% 1 | 0.00%/0.00% 1 | 0.00%/0.10% 0 | 0.00%/1.92% 0 | 0.00%/0.00% 1 | 0.00%/0.12% 0 |
Performance summary
Average calculate count summary
Useful for comparing different score calculators and/or score rule implementations (presuming that the solver configurations do not differ otherwise). Also useful to measure the scalability cost of an extra constraint.
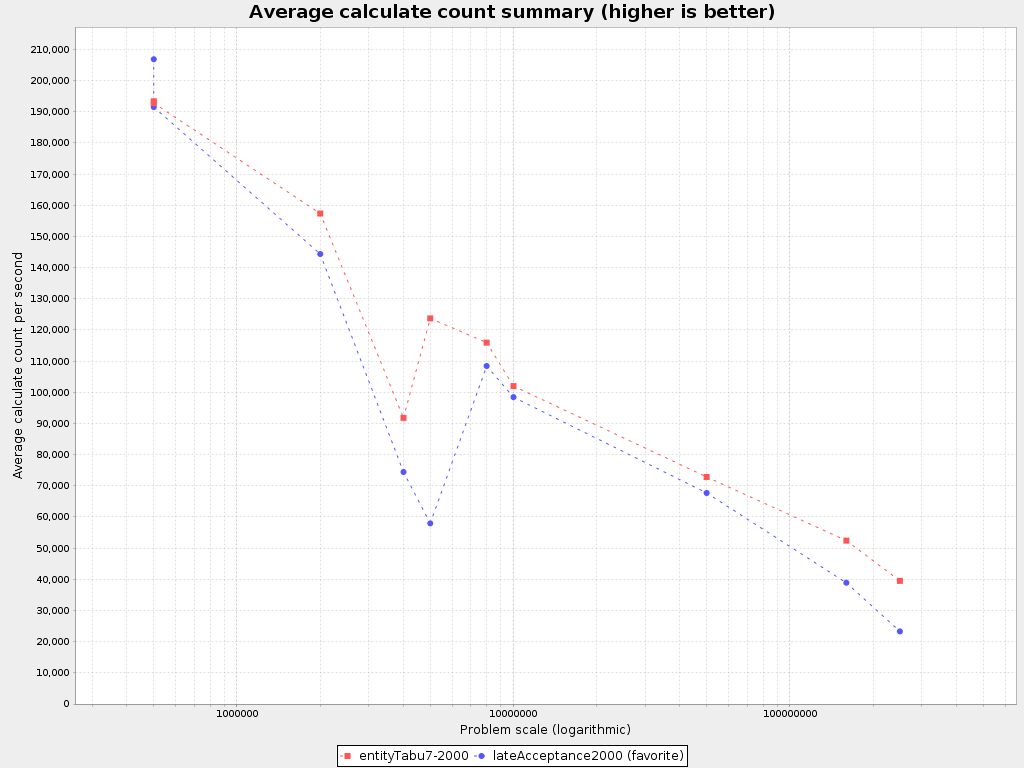
| Solver | Average | Problem | |||||||||
|---|---|---|---|---|---|---|---|---|---|---|---|
| model_b_1 | model_b_2 | model_b_3 | model_b_4 | model_b_5 | model_b_6 | model_b_7 | model_b_8 | model_b_9 | model_b_10 | ||
| Problem scale | 49,000,000 | 500,000 | 500,000 | 2,000,000 | 10,000,000 | 4,000,000 | 8,000,000 | 160,000,000 | 5,000,000 | 50,000,000 | 250,000,000 |
| entityTabu7-2000 1 | 114,165/s | ||||||||||
| lateAcceptance2000 0 | 101,176/s | ||||||||||
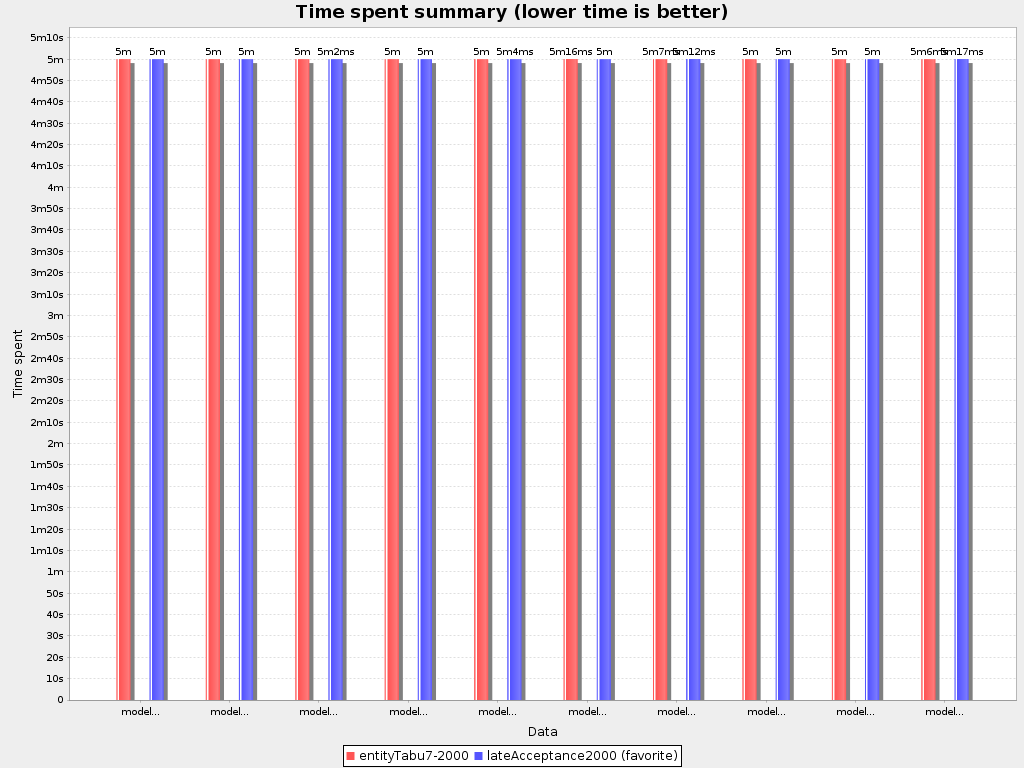
Time spent summary
Useful for visualizing the performance of construction heuristics (presuming that no other solver phases are configured).
| Solver | Average | Problem | |||||||||
|---|---|---|---|---|---|---|---|---|---|---|---|
| model_b_1 | model_b_2 | model_b_3 | model_b_4 | model_b_5 | model_b_6 | model_b_7 | model_b_8 | model_b_9 | model_b_10 | ||
| Problem scale | 49,000,000 | 500,000 | 500,000 | 2,000,000 | 10,000,000 | 4,000,000 | 8,000,000 | 160,000,000 | 5,000,000 | 50,000,000 | 250,000,000 |
| entityTabu7-2000 1 | 300,002 | ||||||||||
| lateAcceptance2000 0 | 300,003 | ||||||||||
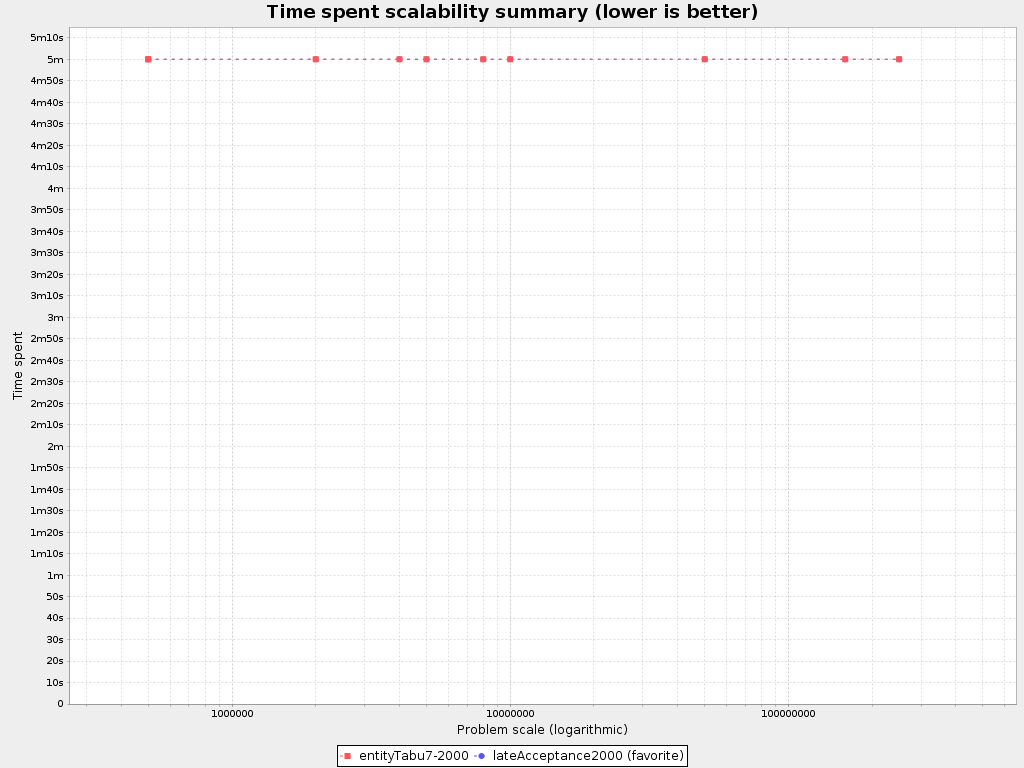
Time spent scalability summary
Useful for extrapolating the scalability of construction heuristics (presuming that no other solver phases are configured).
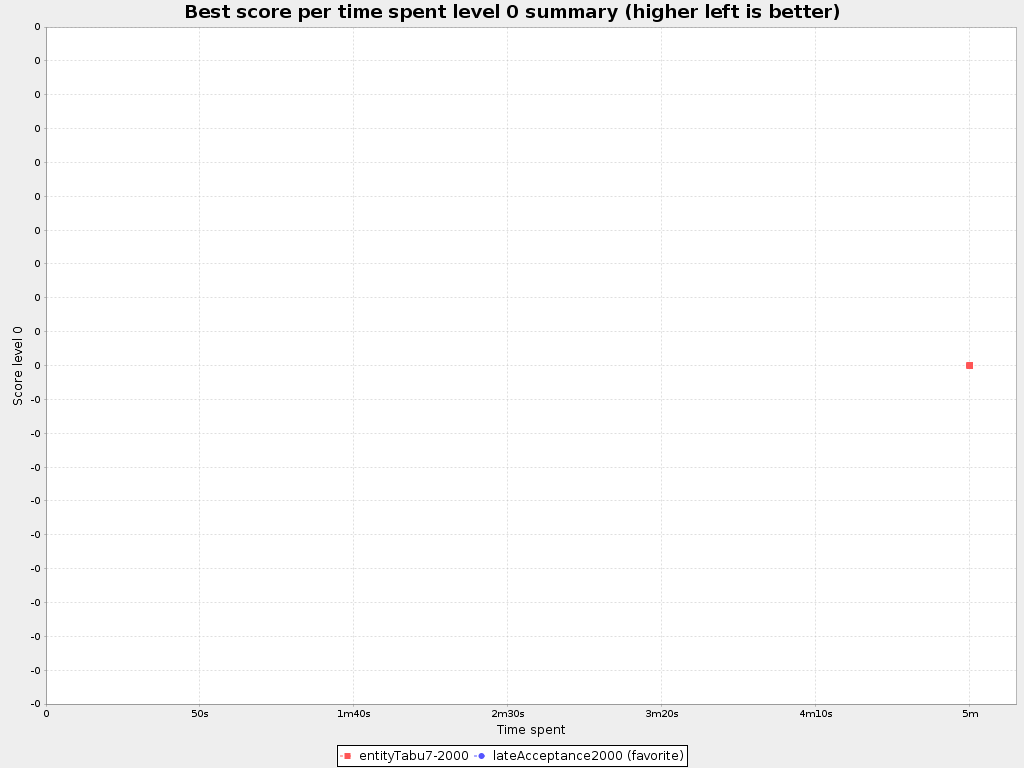
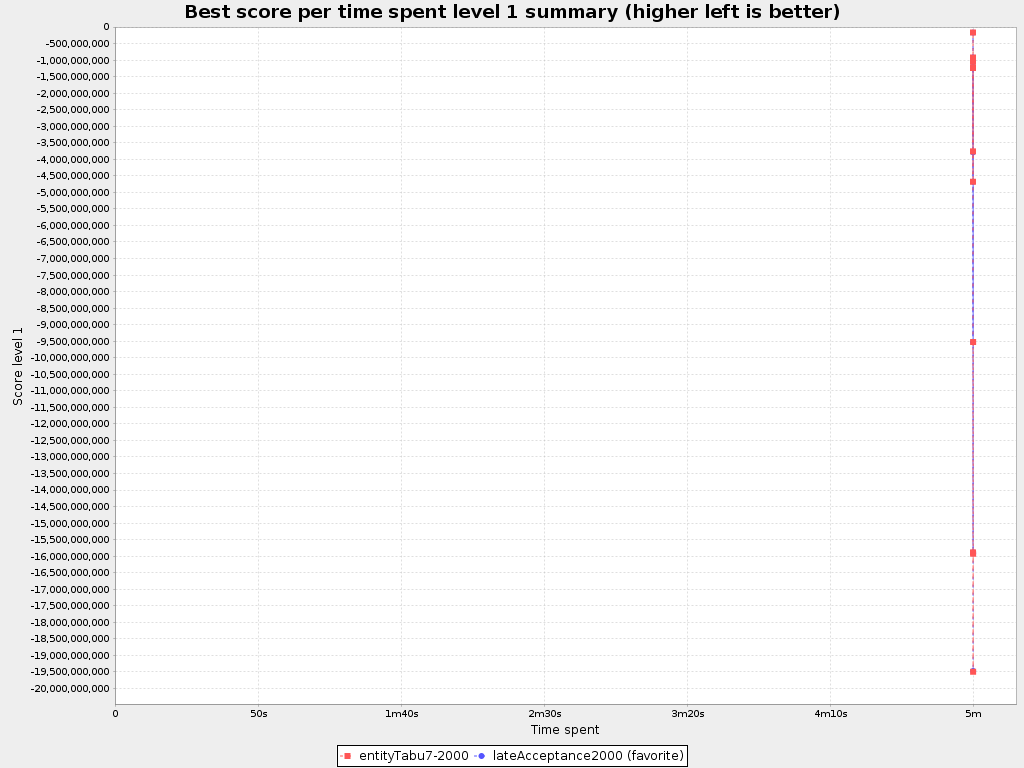
Best score per time spent summary
Useful for visualizing trade-off between the best score versus the time spent for construction heuristics (presuming that no other solver phases are configured).
Problem benchmarks
model_b_1
Entity count: 5,000
Variable count: 5,000
Problem scale: 500,000
Memory usage after loading the inputSolution (before creating the Solver): 7,911,976 bytes on average.

model_b_2
Entity count: 5,000
Variable count: 5,000
Problem scale: 500,000
Memory usage after loading the inputSolution (before creating the Solver): 7,902,892 bytes on average.

model_b_3
Entity count: 20,000
Variable count: 20,000
Problem scale: 2,000,000
Memory usage after loading the inputSolution (before creating the Solver): 15,558,840 bytes on average.

model_b_4
Entity count: 20,000
Variable count: 20,000
Problem scale: 10,000,000
Memory usage after loading the inputSolution (before creating the Solver): 23,445,160 bytes on average.

model_b_5
Entity count: 40,000
Variable count: 40,000
Problem scale: 4,000,000
Memory usage after loading the inputSolution (before creating the Solver): 29,232,400 bytes on average.

model_b_6
Entity count: 40,000
Variable count: 40,000
Problem scale: 8,000,000
Memory usage after loading the inputSolution (before creating the Solver): 27,443,468 bytes on average.
model_b_7
Entity count: 40,000
Variable count: 40,000
Problem scale: 160,000,000
Memory usage after loading the inputSolution (before creating the Solver): 671,197,120 bytes on average.

model_b_8
Entity count: 50,000
Variable count: 50,000
Problem scale: 5,000,000
Memory usage after loading the inputSolution (before creating the Solver): 27,249,560 bytes on average.
model_b_9
Entity count: 50,000
Variable count: 50,000
Problem scale: 50,000,000
Memory usage after loading the inputSolution (before creating the Solver): 60,981,236 bytes on average.

model_b_10
Entity count: 50,000
Variable count: 50,000
Problem scale: 250,000,000
Memory usage after loading the inputSolution (before creating the Solver): 986,275,072 bytes on average.

Solver benchmarks
entityTabu7-2000 1
<solver>
  <environmentMode>PRODUCTION</environmentMode>
  <solutionClass>org.optaplanner.examples.machinereassignment.domain.MachineReassignment</solutionClass>
  <entityClass>org.optaplanner.examples.machinereassignment.domain.MrProcessAssignment</entityClass>
  <scoreDirectorFactory>
    <scoreDefinitionType>HARD_SOFT_LONG</scoreDefinitionType>
    <incrementalScoreCalculatorClass>org.optaplanner.examples.machinereassignment.solver.score.MachineReassignmentIncrementalScoreCalculator</incrementalScoreCalculatorClass>
  </scoreDirectorFactory>
  <termination>
    <minutesSpentLimit>5</minutesSpentLimit>
  </termination>
  <customPhase>
    <customPhaseCommandClass>org.optaplanner.examples.machinereassignment.solver.solution.initializer.ToOriginalMachineSolutionInitializer</customPhaseCommandClass>
  </customPhase>
  <localSearch>
    <unionMoveSelector>
      <changeMoveSelector/>
      <swapMoveSelector/>
    </unionMoveSelector>
    <acceptor>
      <entityTabuSize>7</entityTabuSize>
    </acceptor>
    <forager>
      <acceptedCountLimit>2000</acceptedCountLimit>
    </forager>
  </localSearch>
</solver>
lateAcceptance2000 0
<solver>
  <environmentMode>PRODUCTION</environmentMode>
  <solutionClass>org.optaplanner.examples.machinereassignment.domain.MachineReassignment</solutionClass>
  <entityClass>org.optaplanner.examples.machinereassignment.domain.MrProcessAssignment</entityClass>
  <scoreDirectorFactory>
    <scoreDefinitionType>HARD_SOFT_LONG</scoreDefinitionType>
    <incrementalScoreCalculatorClass>org.optaplanner.examples.machinereassignment.solver.score.MachineReassignmentIncrementalScoreCalculator</incrementalScoreCalculatorClass>
  </scoreDirectorFactory>
  <termination>
    <minutesSpentLimit>5</minutesSpentLimit>
  </termination>
  <customPhase>
    <customPhaseCommandClass>org.optaplanner.examples.machinereassignment.solver.solution.initializer.ToOriginalMachineSolutionInitializer</customPhaseCommandClass>
  </customPhase>
  <localSearch>
    <unionMoveSelector>
      <changeMoveSelector/>
      <swapMoveSelector/>
    </unionMoveSelector>
    <acceptor>
      <lateAcceptanceSize>2000</lateAcceptanceSize>
    </acceptor>
    <forager>
      <acceptedCountLimit>500</acceptedCountLimit>
    </forager>
  </localSearch>
</solver>
Benchmark information
| Name | 2015-09-25_214854 |
|---|---|
| Aggregation | false |
| Failure count | 0 |
| Starting timestamp | Sep 25, 2015 9:48:54 PM |
| Warm up time spent | 30,000 ms |
| Parallel benchmark count / available processors | 1 / 8 |
| Benchmark time spent | 36,167,822 ms |
| Environment mode | PRODUCTION |
| Logging level | debug |
| Solver ranking class | TotalScoreSolverRankingComparator |
| VM max memory (as in -Xmx but lower) | 7,635,730,432 bytes |
| OptaPlanner version | Unjarred development snapshot |
| Java version | Java 1.7.0_79 (Oracle Corporation) |
| Java VM | Java Java HotSpot(TM) 64-Bit Server VM 24.79-b02 (Oracle Corporation) |
| Operating system | Linux amd64 4.1.6-201.fc22.x86_64 |
| Report locale | en_US |