JBoss.orgCommunity Documentation
Version: 3.0.0.beta1
Copyright © 2008 JBoss, a division of Red Hat Inc.
August 2008
BIRT plugin for JBoss Developer Studio is an Eclipse-based open source reporting system for web applications based on Java and J2EE. BIRT consists of two main components: a report designer based on Eclipse, and a runtime component that can be added to your app server. BIRT also offers a charting engine that lets you add charts to your own Web application.
With the help of BIRT you can generate a great number of reports to be used in your application:
Lists
Charts
Crosstabs, or cross-tabulation, or matrix
Letters and Documents
Compound Reports
In this guide we provide you with the information on BIRT Designer which allows you to create a report much faster and with far fewer errors so sparing your time.
You can find detailed information on the BIRT report types and anatomy here:
JBoss BIRTAll JBoss Developer Studio/JBoss Tools documentation you can find here.
The latest documentation builds are available here.
In this section we will focus more on all concepts that JBoss Tools integrates for working with BIRT.
This chapter will provide you with detailed information on how to install BIRT plugin into JBoss Developer Studio.
Since BIRT plugin is one of the modules of JBoss Tools project it has a dependence on other modules and will require their pre-installation.
These are the prerequisites to create a web project including Seam and BIRT capabilities:
Eclipse Version 3.4 SDK
DTP Version 1.6 Release
EMF Version 2.4 Release EMF+XSD
GEF Version 3.4 Release runtime
WTP Version 3.0 Release
BIRT Report Designer SDK 2.3.0 Release or BIRT Report Designer 2.3.0 Release
JBoss Application Server 4.2.2 GA
JBoss Seam 2.0.1 GA
JBoss Tools nightly build
To understand Hibernate configuration, integration with Seam, and deployment see JBoss BIRT Integration 1.0.0.alpha1 - New and Noteworthy.
In this chapter we suggest a step-by-step walk-through of creating your own BIRT report.
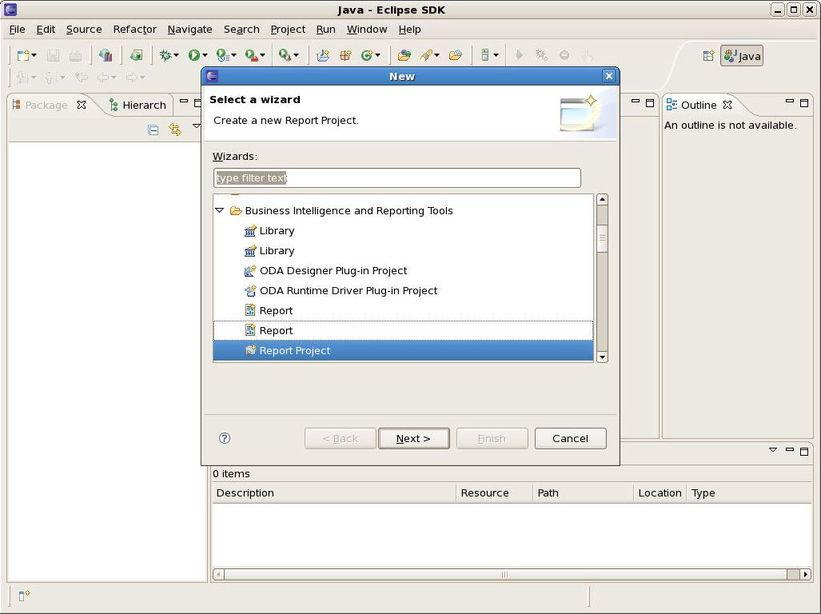
First create a Report project. Select File > New > Project... in the main menu bar or context menu. The new project dialog appears. Choose Business Intelligence and Reporting Tools > Report Project:
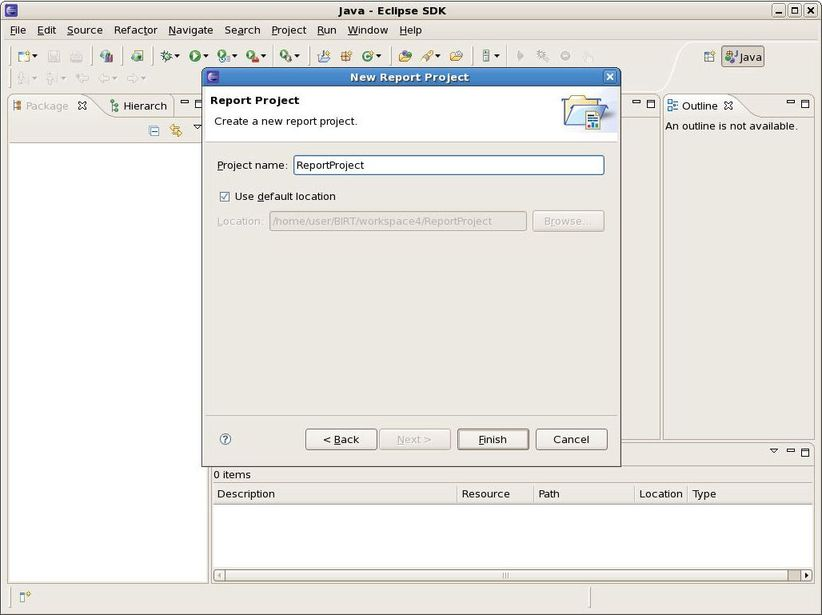
Click on the Next button. Specify a name for the project and change location if necessary:
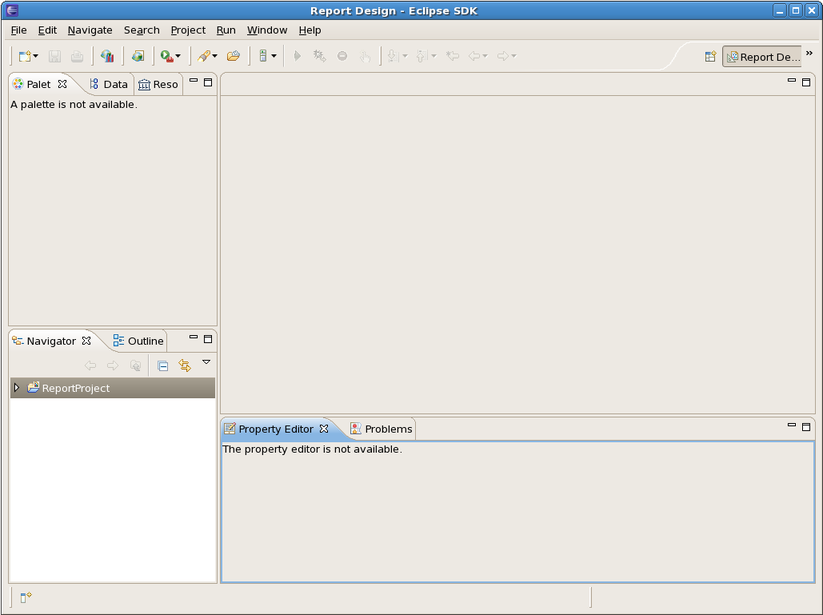
Click on the Finish button. Click Ok to switch to the Report Design perspective. Your Report Project is now created:
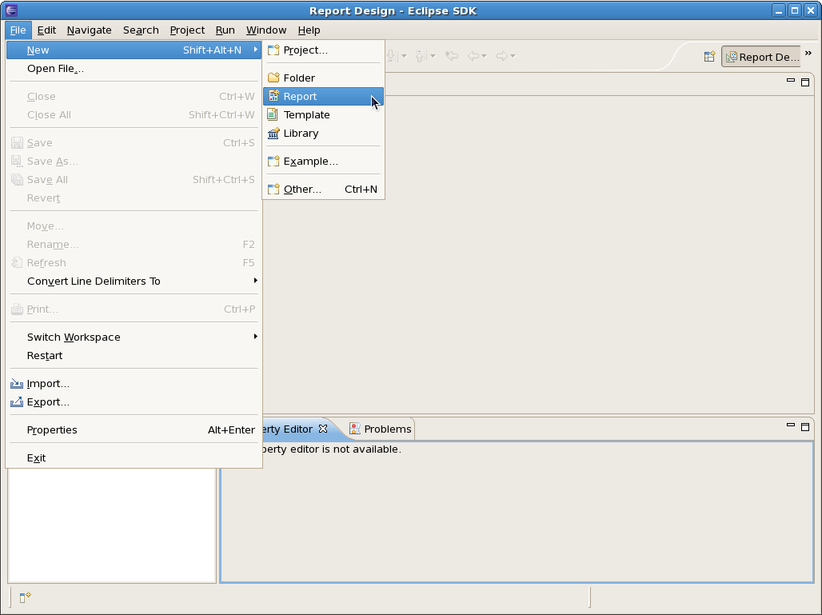
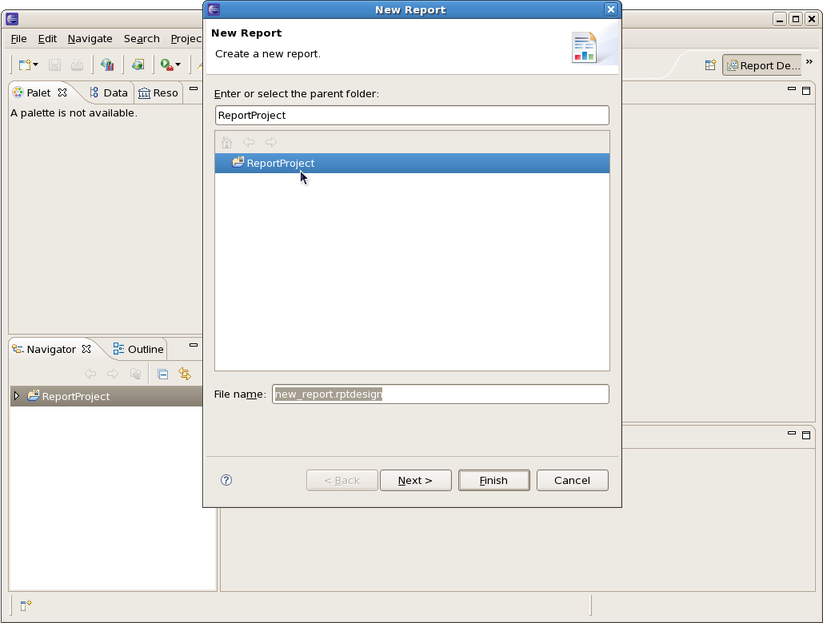
Now you can create a Report. Go to File > New > Report...:
The new report dialog appears. Select the created project as a parent folder in the tree view:
Click on the Next button. Then select the type of the template to use for your report. Each template is shown in the Preview window and is described below. Tick off the "Show Report Creation Cheat Sheet" checkbox if you don't need the Cheat Sheets view to be displayed. The Cheat Sheets view can walk you though the process of creating a report based on the template you selected.
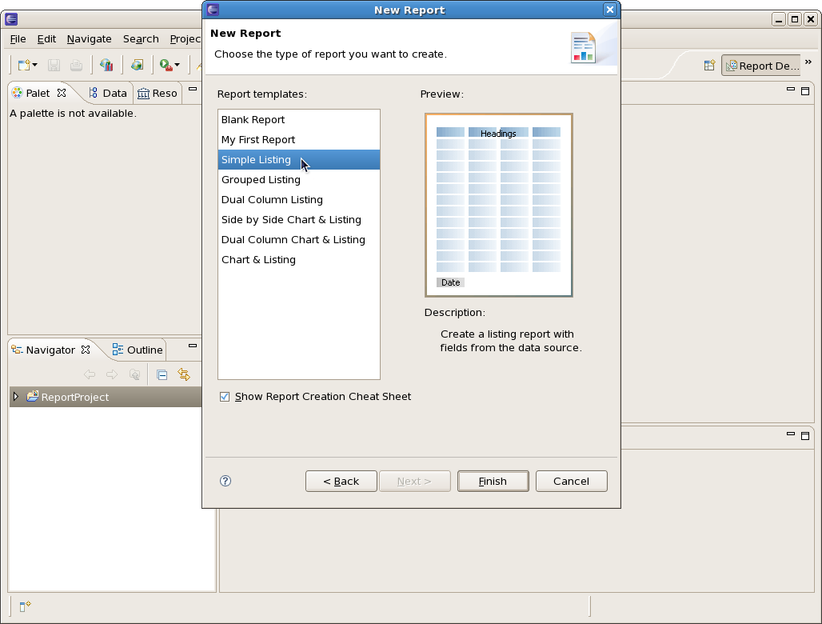
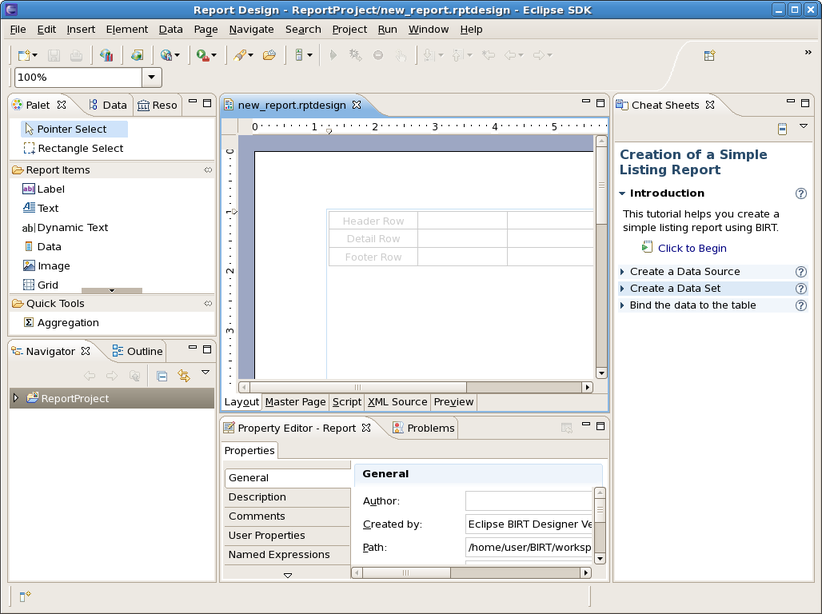
Click on the Finish button to open the newly created report in the workspace:
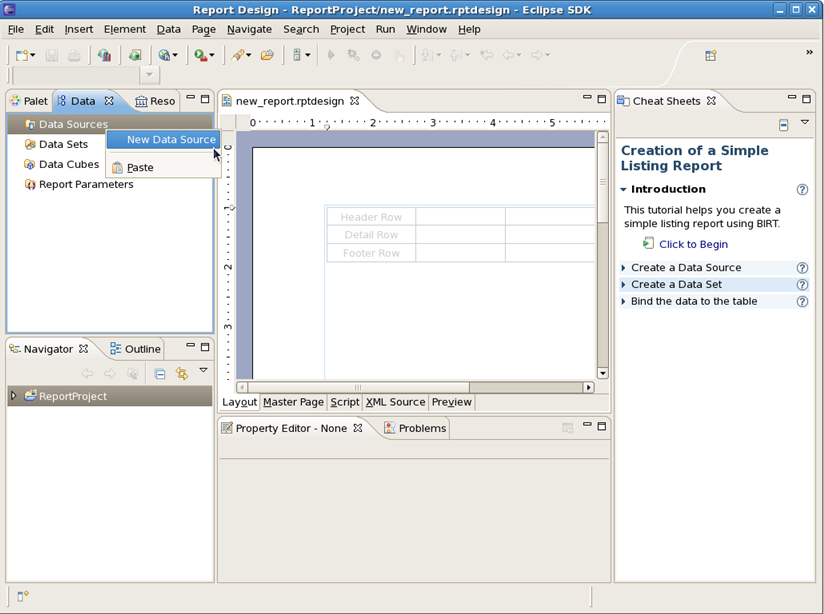
Data source is used to connect to the database. In order to create a data source for your report follow these steps:
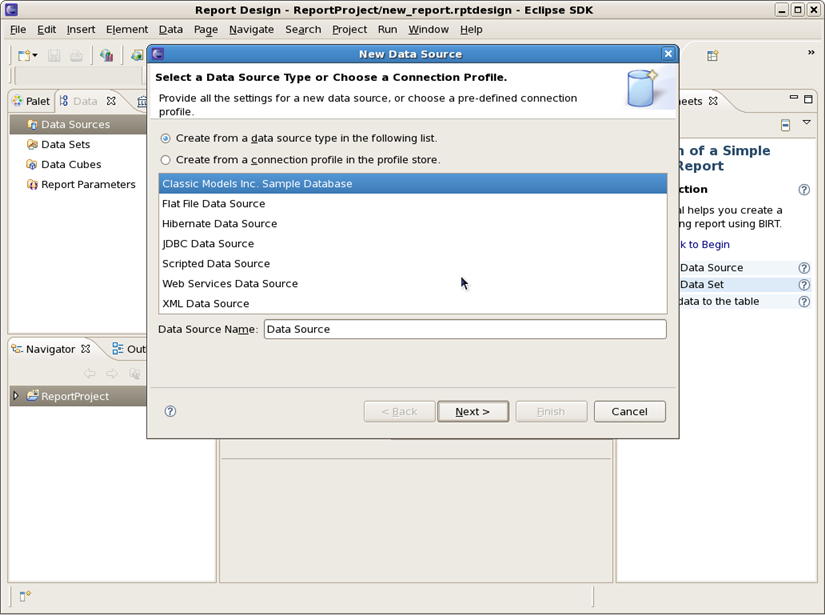
Open the Data Explorer View. Select Data Sources, right-click on it and choose New Data Source:
The New Data Source dialog appears. Choose the "Create from a data source type in the following list" radiobutton and then "Classic Models Inc. Sample Database". Click on the Next button:
The newly created data source details wll be displayed: Driver Class, Database URL and Database User:
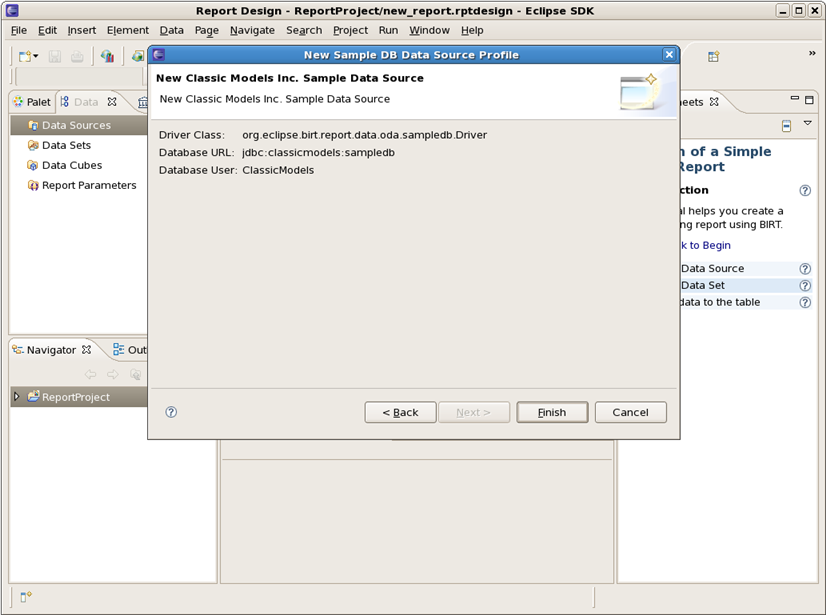
Click on the Finish button to add the data source to the data source for your report.
If you need to edit the data source right-click on it and select the corresponding option.
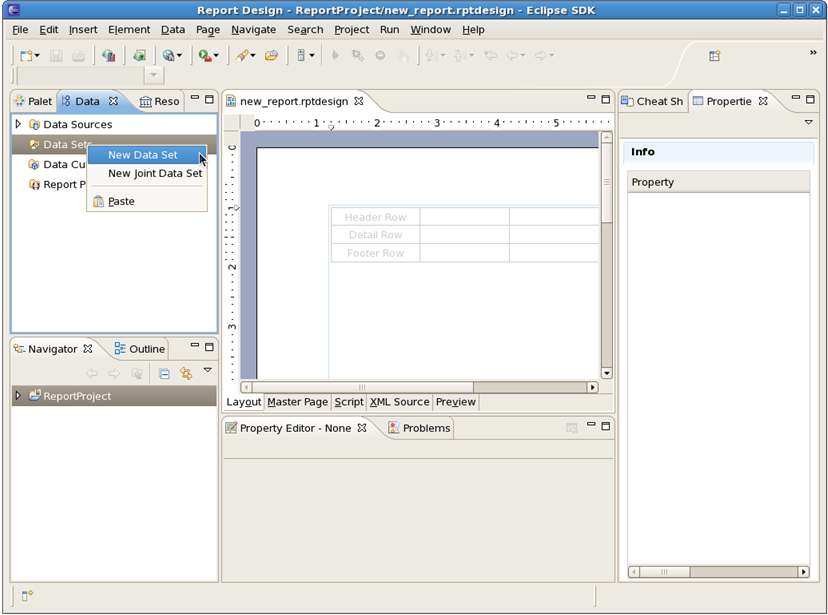
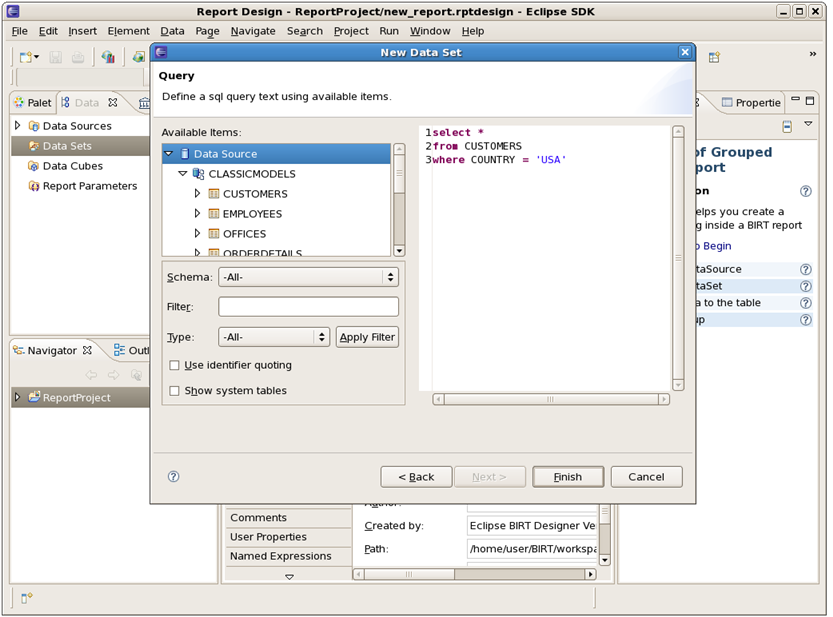
Data Set is a query to get and represent necessary column data from the data source specified. Select Data Sets in the tree view, right-click on it and select New Data Set:
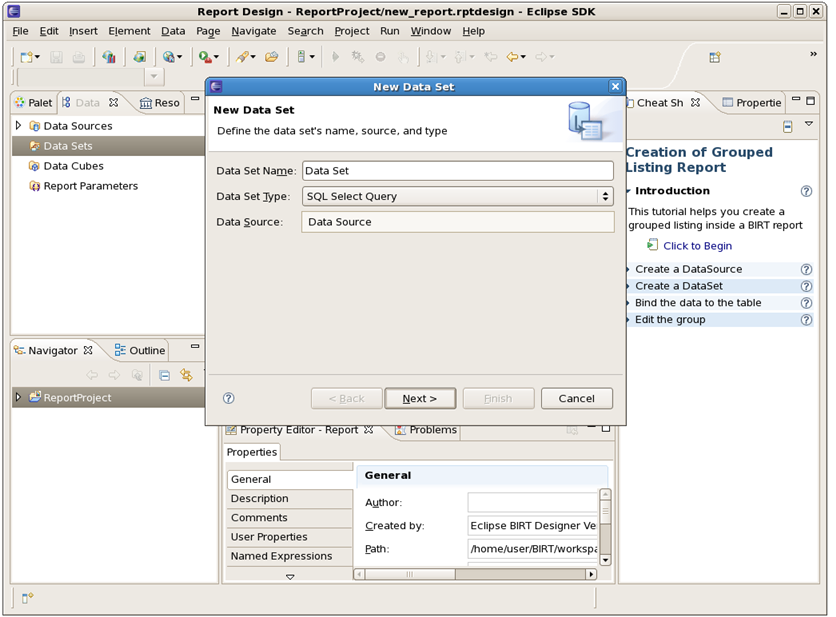
The New Data Set dialog will appear. Enter a name for the Data Set Name field and ensure that the Data Source field shows the data source already created and that the Data Set Type field is set to "SQL Select Query". Then click on the Next button:
Enter the following details into the query:
SELECT *
FROM CUSTOMERS
WHERE COUNTRY = 'USA'
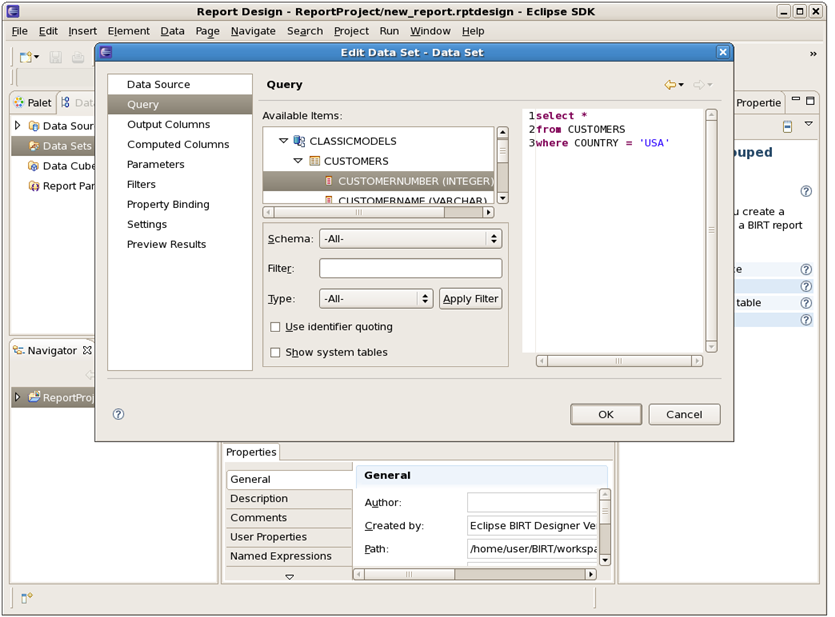
Click on the Finish button. The Edit Data Set window opens where you can change Data Source, Settings, Parameters and other details for the Data Set created. If switched to the Query page you can check the schemas within this database, you can expand them to see the list of tables with their columns:
Switch to the Preview page to test your query and verify whether the list of customers appears:
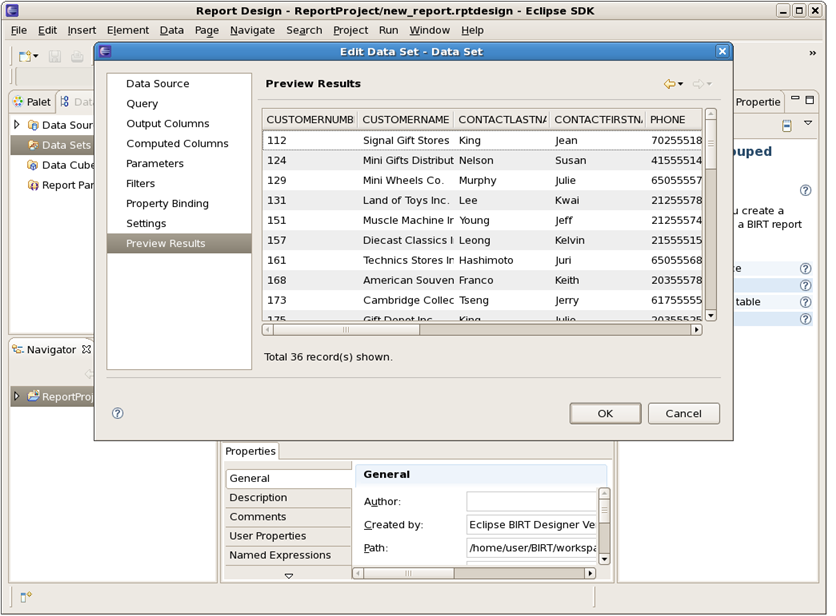
Click on the Ok button.
After the Data source and Data set are specified you can continue with the report layout. Please see the Birt_Designer chapter to learn more about BIRT Report Designer.
BIRT Designer is an intuitive and quite easy Eclipse-based set of plugins to make reports. In this chapter we will describe its interface and its features to you.
The central part of the user interface is the Layout Editor. It displays the whole process of building a report and contains the following tabs:
Layout - this is an area where you can edit your report design;
Preview - runs your report created and shows the output;
Script - on this page you can add JavaScript to your report to customize its behavior;
XML Source - this is an area where you can view and modify the XML source of your report;
Master Page - use it to format page data.
The next part of user interface is different Views that can be arranged around the Layout Editor area the way you like:
Palette - shows the standard report items you can add to your report using drag and drop.
Outline - shows the structure of your report as a tree view.
Navigator - shows your projects and reports within the projects.
Data Explorer - shows your data sources, data sets and report parameters. You also can use this view to add data set columns to your report layout.
Property Editor - displays properties for many report items.
Properties View - shows all properties for a report item as a simple list.
Library Explorer View - allows the reuse of report objects, such as tables, data sources and styles. Objects created for reuse are stored in a library file. The Library Explorer will display Libraries that exist in the Resource folder. Developed libraries can be added to the resource folder by selecting File→Publish Library in Resource Folder. The resource folder location can be configured.
Here are the main BIRT Report Designer features:
Palette - contains tables, labels, and charts. It is used in conjunction with the Layout View to design reports.
Data Explorer - organizes your data sources and data sets. The Data Sets editor enables testing your data set to check whether the report receives the correct data. You can also create cubes using your data sets (when building any dynamic cross tables) and design necessary report parameters.
Resource Explorer - BIRT allows the reuse of report objects, such as tables, data sources and styles. Objects created for reuse are stored in a library file. To browse the contents of report libraries BIRT supplies the Resource Explorer view. This view lists all libraries within the resource folder, in addition to other shared content such as images and JavaScript files.
Property Editor - shows the most commonly used properties. BIRT also integrates with the standard Eclipse property view to display a detailed listing of all properties for an item.
Layout View - WYSIWYG editor. You can select any element from the Palette, drag and drop it to the report and then edit the way you like.
Script Editor - scripting adds business logic to reports during data access, report generation, or viewing. The code editor provides standard features for editing scripts: syntax coloring, auto-complete etc. You also can debug scripts when the report is running.
Report Preview - Report Preview is used to test your newly created report with some real data.
Chart Builder - using the Chart Builder you can add any charts to the design of your report. Just select a chart type, then data and, finally, format the chart.
Expression Builder - expressions are simple scripts that return a value. They are used to assign data values to report elements, build image locations, hyperlinks, parameter default values etc.
Cheat Sheets - Cheat sheets are small pices of useful documentation that lead you through a report creation process. Just select what you need and then follow the instructions.
Outline - this view provides a compact overview of the entire report structure.
In this guide we made a simple overview of the BIRT plugin: its installation, support, features etc. that will help you to make your first steps with it.