Despite Dashbuilder is an standalone dashboard composition tooling, integration with external systems might be required. For instance:
Imagine a third-party web app which relies on Dashbuilder to provide the monitoring capabilities. The web app requires to embed a chart into one of its pages. This would be an example of content syndication.
Imagine also another application which want to push/pull data from Dashbuilder. A SAP system, for instance, which want to push a new purchase order to an specific Dashbuilder data provider, or a external alert management system which requires to evaluate the current value for a given KPI.
These and many others are examples of integration uses cases. This chapter walks through the different mechanisms that Dashbuilder provides in that direction.
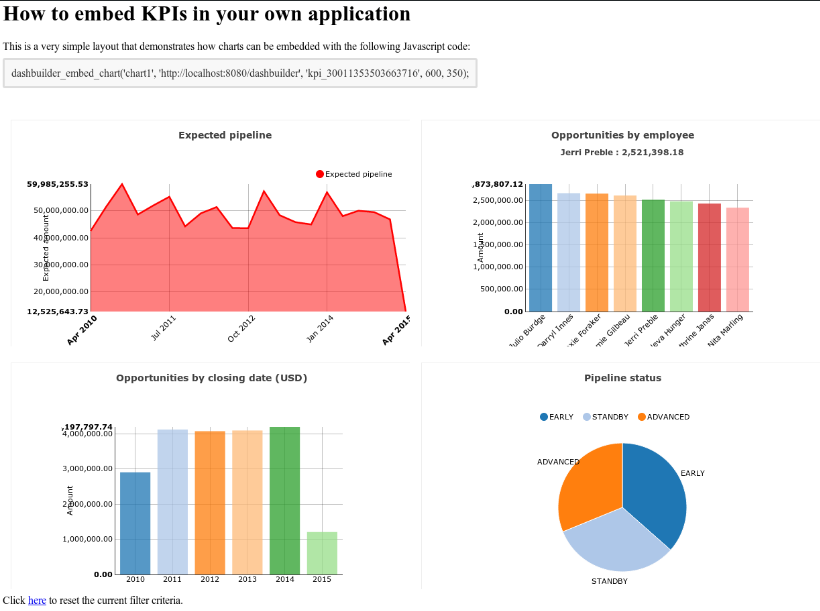
Dashbuilder provides the ability to embed dashboard charts into your own web app via a lightweight easy to use JavaScript API. Once a dashboard is built, it's possible to pick up any KPI and paste it into any web application.
The following HTML sample page shows how to achieve so.
    <html>
      <head>
        <title>Dashbuilder Javascript API</title>
        <script src="http://localhost:8080/dashbuilder/js-api/dashbuilder-1.0.0.js"></script>
        <style type="text/css">
          .code {
            padding:10px;
            background-color: rgb(248, 248, 248);
            border-color: rgb(221, 221, 221);
            border-radius: 3px;
            border-style: solid;
            box-sizing: border-box;
            color: rgb(51, 51, 51);
            font-weight: normal;
          }
        </style>
      </head>
      <body onload="embedCharts();">
        <h1>How to embed KPIs in your own application</h1>
        This is a very simple layout that demonstrates how charts can be embedded with the following Javascript code:
        <br/><br/>
        <span class="code">dashbuilder_embed_chart('chart1', 'http://localhost:8080/dashbuilder', 'kpi_30011353503663716', 600, 350);</span>
        <br/><br/><br/>

        <!-- Very simple layout with charts -->
        <table border="0" cellpadding="5" >
          <tr>
            <td id="chart1"></td>
            <td id="chart2"></td>
          </tr>
          <tr>
            <td id="chart3"></td>
            <td id="chart4"></td>
          </tr>
        </table>
        <!-- End of charts -->

        Click <a href="#" onclick="embedCharts(); return false;">here</a> to reset the current filter criteria.

        <script type="text/javascript">
          function embedCharts() {
            var dashbuilderUrl = 'http://localhost:8080/dashbuilder';
            dashbuilder_embed_chart('chart1', dashbuilderUrl, 'kpi_30301353506280659', 600, 350);
            dashbuilder_embed_chart('chart2', dashbuilderUrl, 'kpi_30041353504912610', 600, 350);
            dashbuilder_embed_chart('chart3', dashbuilderUrl, 'kpi_30441353507392054', 600, 350);
            dashbuilder_embed_chart('chart4', dashbuilderUrl, 'kpi_30251353675275870', 600, 350);
          }
        </script>
      </body>
    </html>

As you can see in the source code of the example, all the KPIs are embedded using the following API call:
dashbuilder_embed_chart(chartId, dashbuilderUrl, kpiId, width, height);
chartId: It's the id of the HTML element where the KPI will be inserted.
dashbuilderUrl: The fully qualified URL of the Dashbuilder app.
kpiId: The identifier of the KPI (provided by the Dashbuilder app). It can be obtained by editing the KPI panel from the Dashbuilder UI. Just go to the dashboard where the KPI is placed, edit the panel (admin rights required) and copy & paste the KPI id (see the image below).
width/height: The total size of the display area used to render the KPI.
