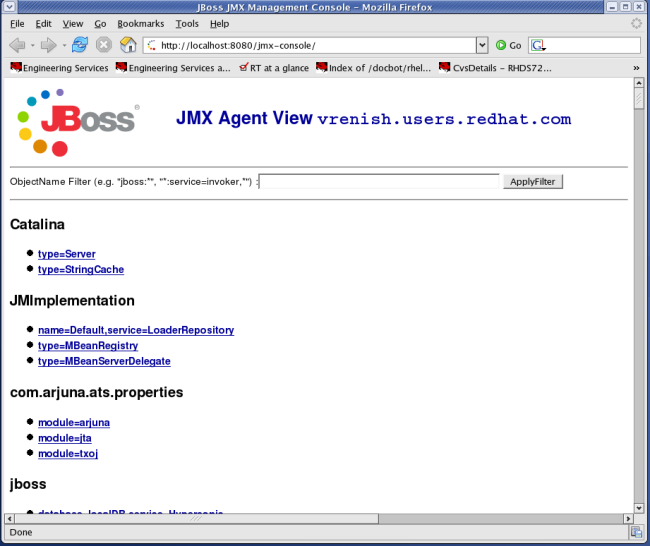
When the JBoss Server is running, you can get a live view of the server by going to the JMX console application at http://localhost:8080/jmx-console. You should see something similar to Figure 1.1, “View of the JMX Management Console Web Application”.
The JMX Console is the JBoss Management Console which provides a raw view of the JMX MBeans which make up the server. They can provide a lot of information about the running server and allow you to modify its configuration, start and stop components and so on.
For example, find the service=JNDIView link and click on it. This particular MBean provides a service to allow you to view the structure of the JNDI namespaces within the server. Now find the operation called list near the bottom of the MBean view page and click the invoke button. The operation returns a view of the current names bound into the JNDI tree, which is very useful when you start deploying your own applications and want to know why you can’t resolve a particular EJB name.
Look at some of the other MBeans and their listed operations; try changing some of the configuration attributes and see what happens. With a very few exceptions, none of the changes made through the console are persistent. The original configuration will be reloaded when you restart JBoss, so you can experiment freely without doing any permanent damage.
Note
If you installed JBoss using the graphical installer, the JMX Console will prompt you for a username and password before you can access it. If you installed using other modes, you can still configure JMX Security manually. We will show you how to secure your console in Section 1.4.3, “Security Service”.