This section describes how to use the Runtime Governance User Interface (UI).
To access the Runtime Governance UI, after the server has been started, use the url: <host>/rtgov-ui
Once displayed, it will request an username and password. When successfully logged in, you will be presented with the top level dashboard:
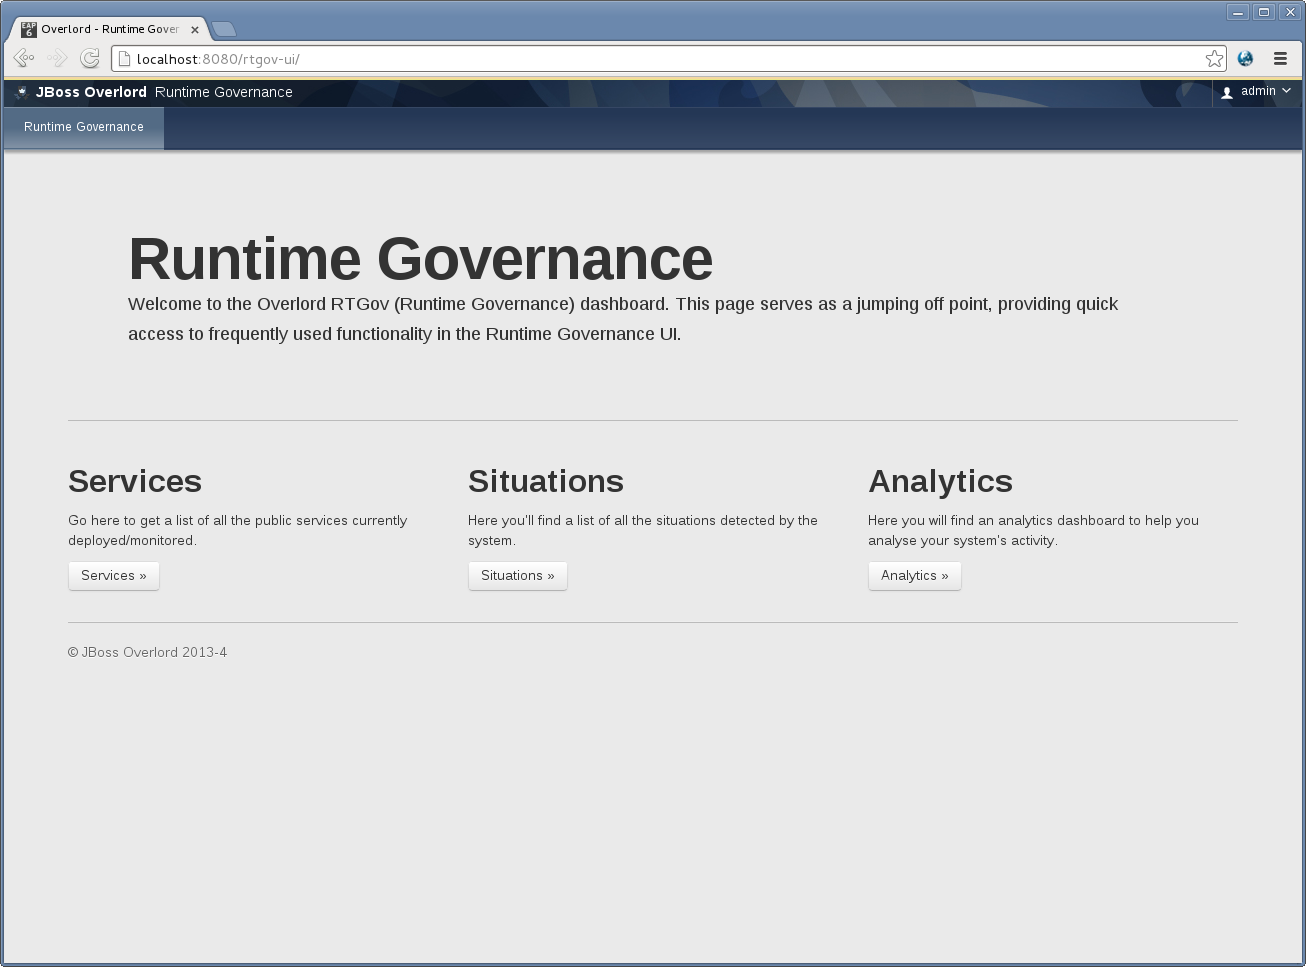
The dashboard provides access to three types of information related to runtime governance. These will be discussed in more detail in the following sections.
The Services page lists the services that have been deployed to a service container (e.g. switchyard) and are being monitored by RTGov.
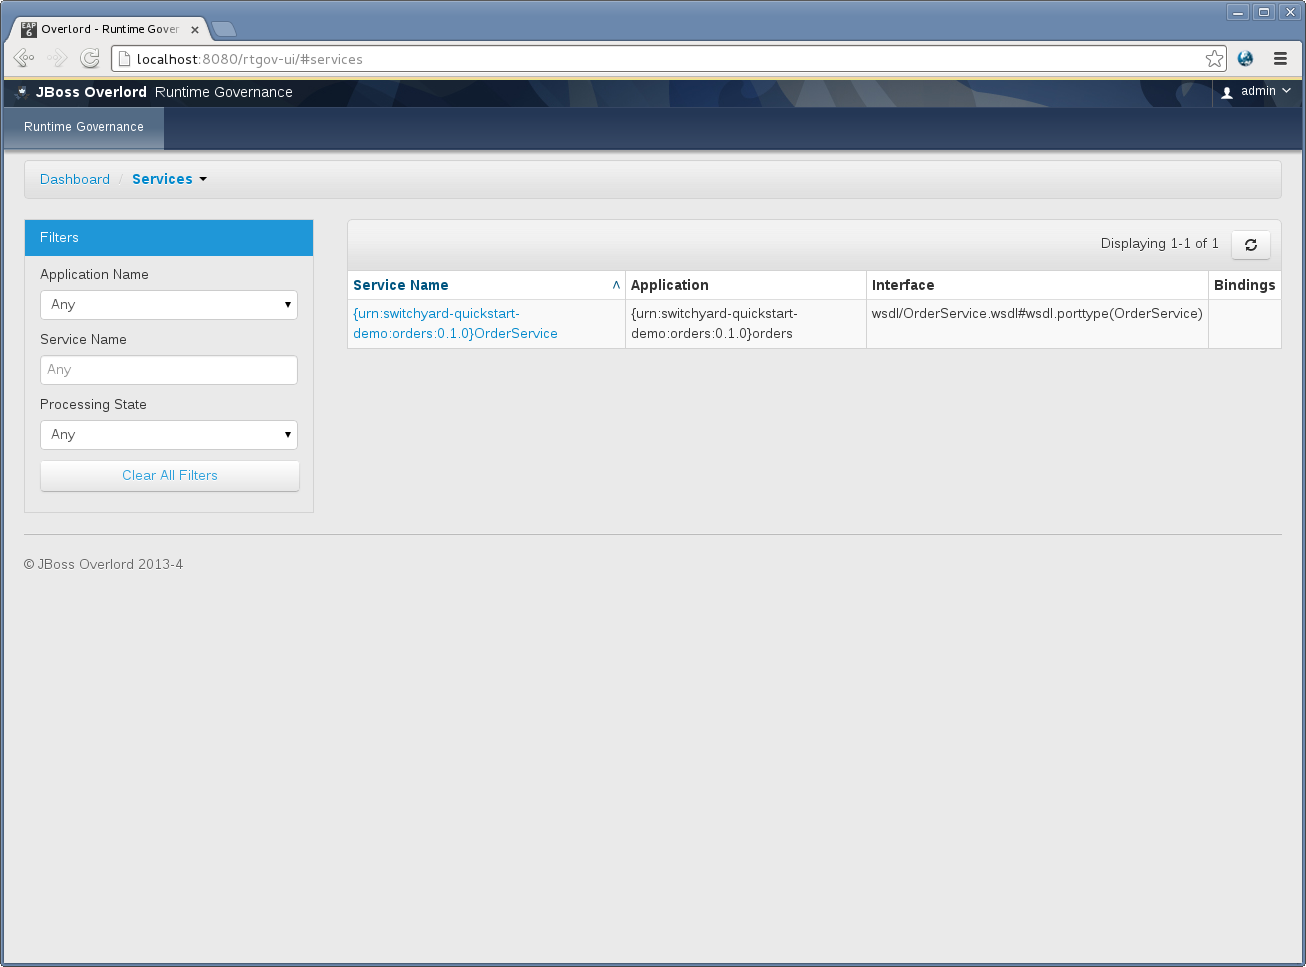
The list shows the service name, optional application in which it is contained, the external interface(s) it implements and finally the bindings through which it can be accessed.
Note
For switchyard services, this list will only contain the public (promoted) services, however activity information will be collected for internal component services as well.
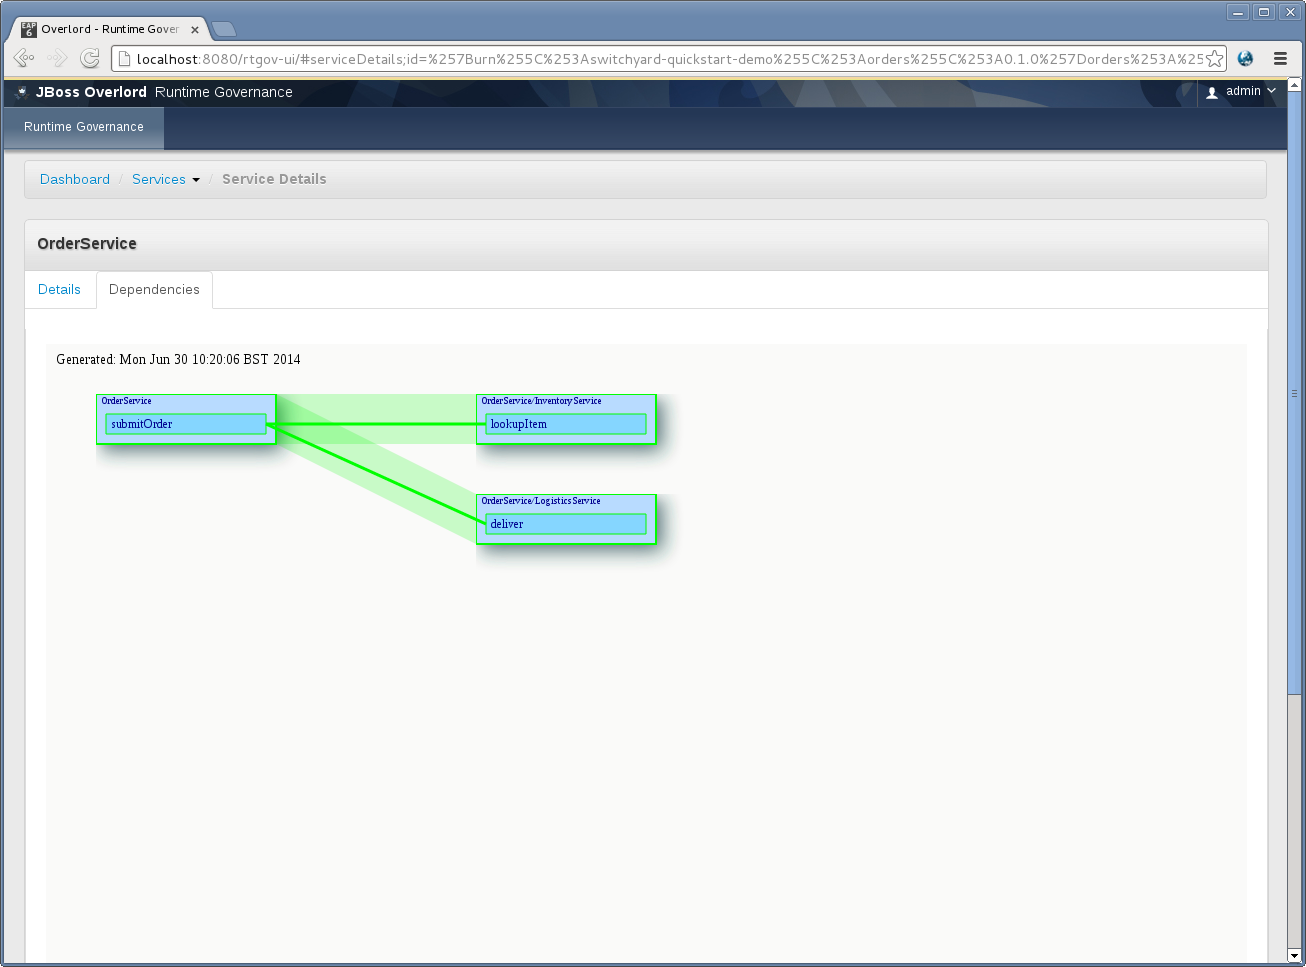
When a service name is selected, it will navigate to the details page:
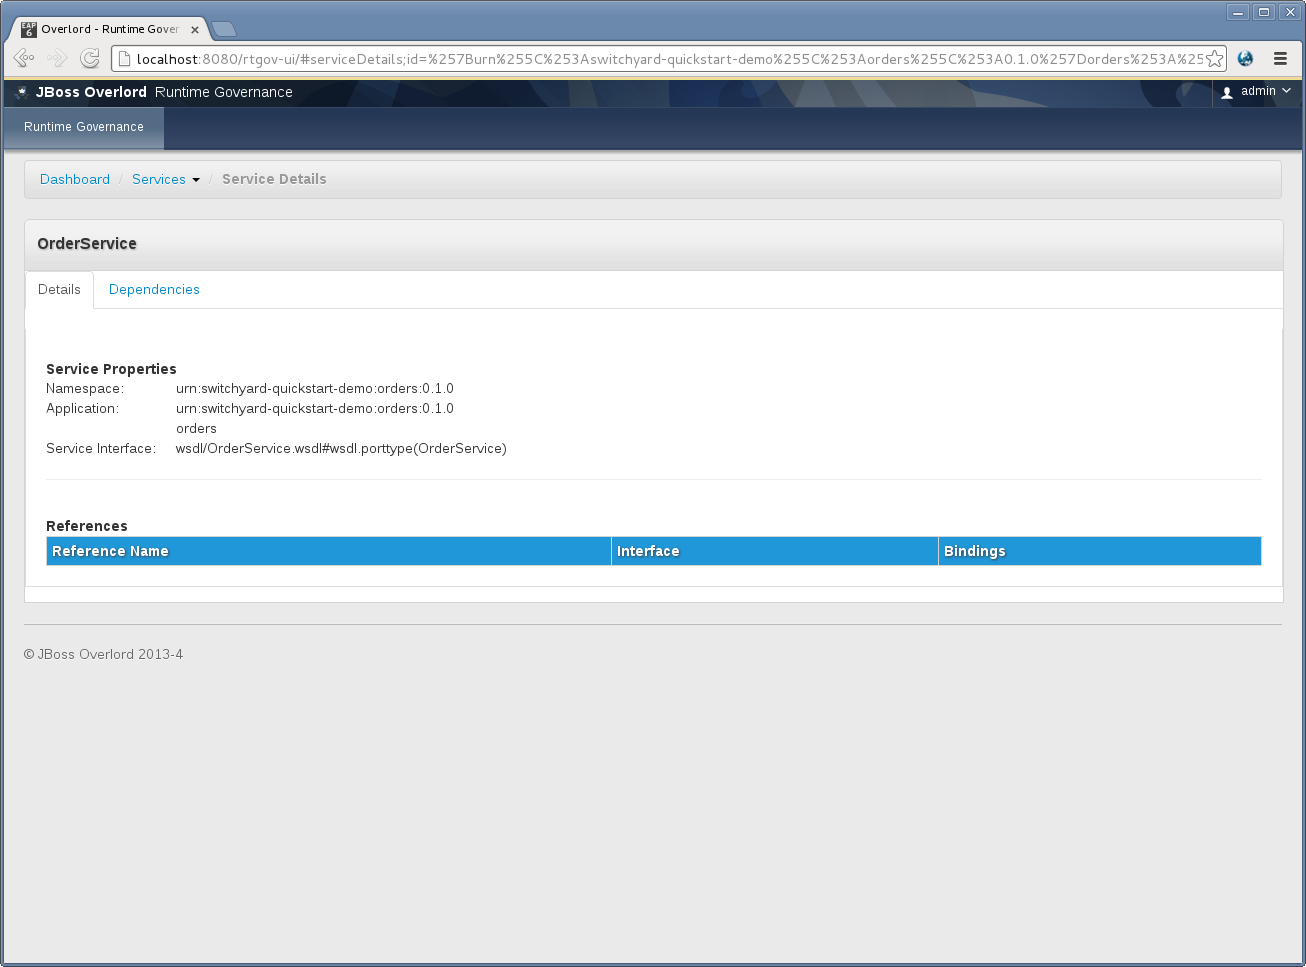
This page shows high level information about the service, and where appropriate, any promoted references it has to other external services.
The Dependencies tab can be used to view dynamic dependency information about the service. This information is based on a short term rolling window, and will therefore only show the relationships associated with recent invocations:
This section shows the Situations that are reported when RTGov policies detect issues that need to be bought to the attention of users.
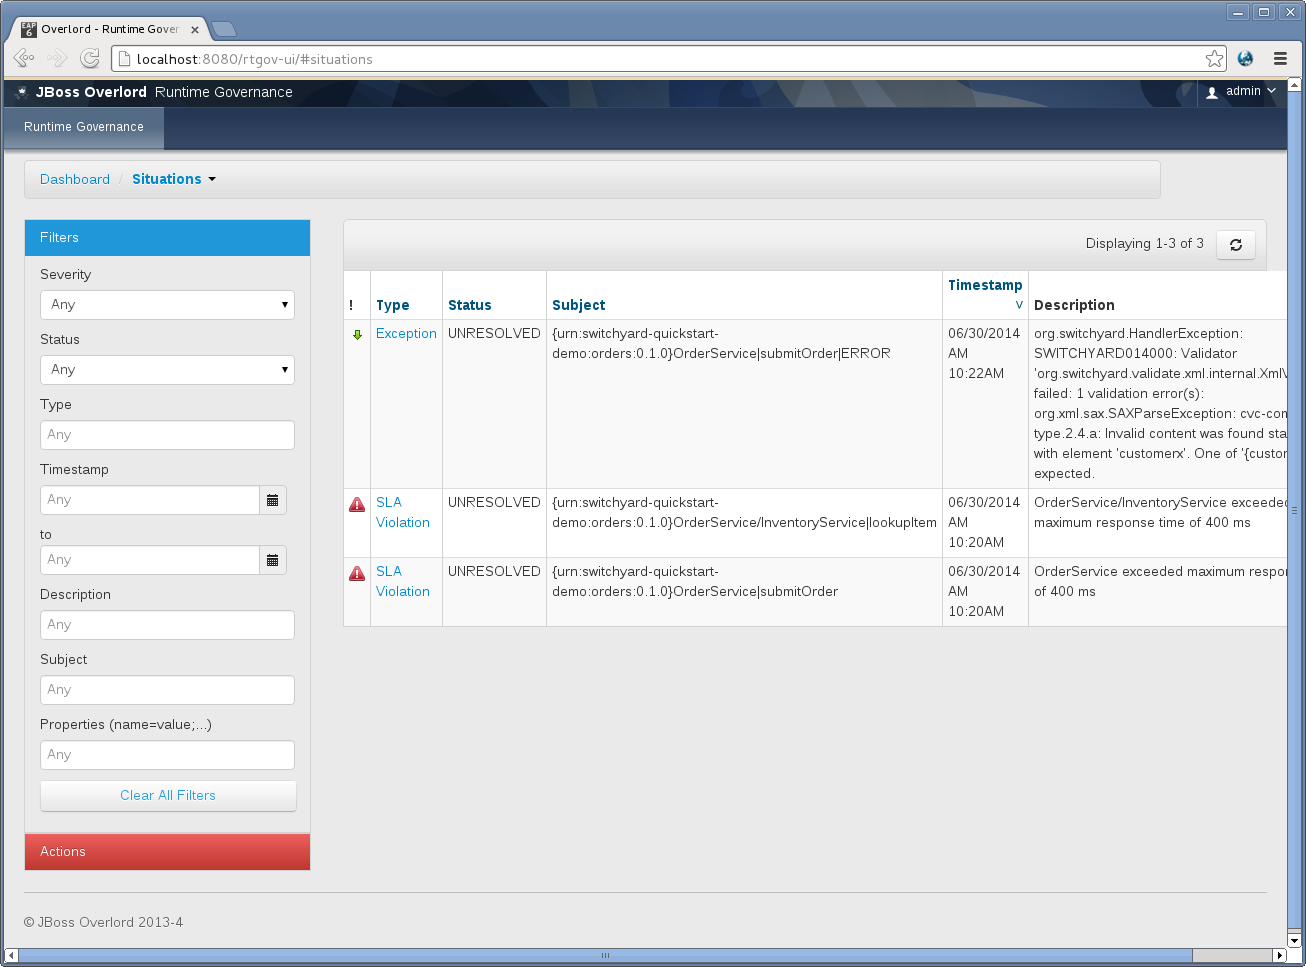
The left hand panel provides a variety of options for filtering the list of situations.
The list contains the following columns:
- Severity - an icon to indicate how severe the situation is.
- Type - identifies the nature of the situation (e.g. SLA Violation, Exception, etc).
- Status - where the situation is in its lifeycycle (see further down for description of the lifecycle). The status Open represents all non-resolved states.
- Subject - the subject of the situation, which will generally be a service type and operation, with optional fault name.
- Timestamp - when it occurred.
- Description - further details about the situation.
- Action - show properties for the situation.
At the bottom left is a collapsed region containing controls for performing bulk actions.
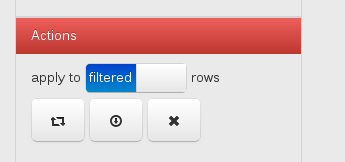
These actions can operate either on the filtered situations (as shown here), or all situations. The actions themselves, from left to right, are resubmit (i.e. resubmit an associated message to the target service), export and remove.
When a new Situation occurs, if the user is already viewing the situations page, then a small notification will be displayed in the top right corner:
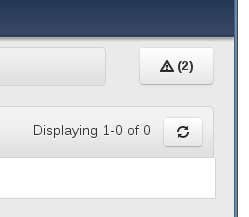
If this notification is expanded, it will list some of the details for the new Situations:
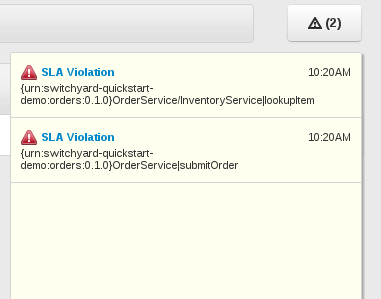
The user can either select one of the entries to navigate to it’s details, or alternatively use the refresh button to update the list.
To view the details associated with a Situation in the list, select its type field, which will navigate to the details page.
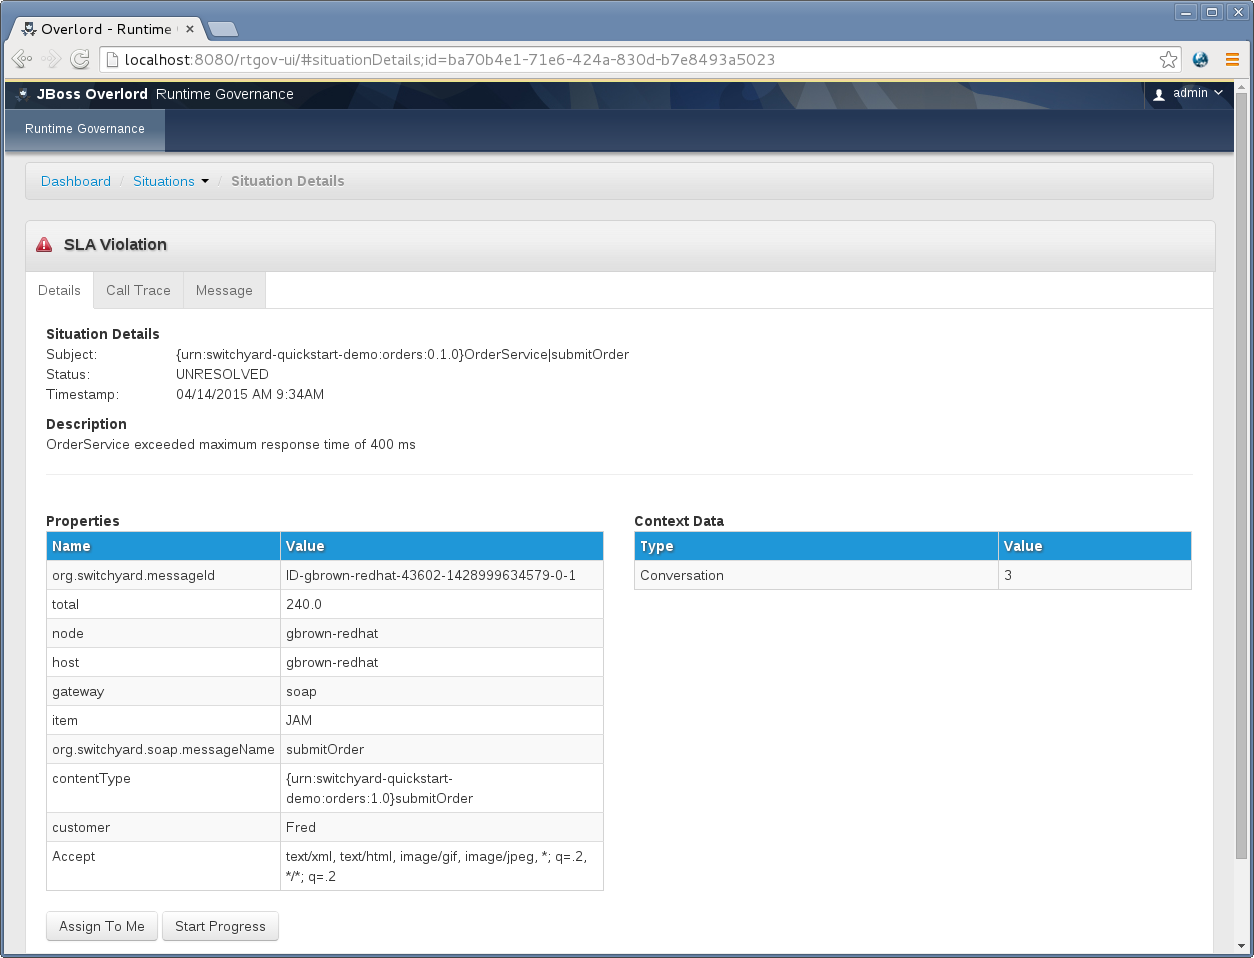
This page shows the details of the situation, including properties and context data.
The Call Trace tab shows the call stack associated with the business transaction, if appropriate context information has been recorded with the situation.
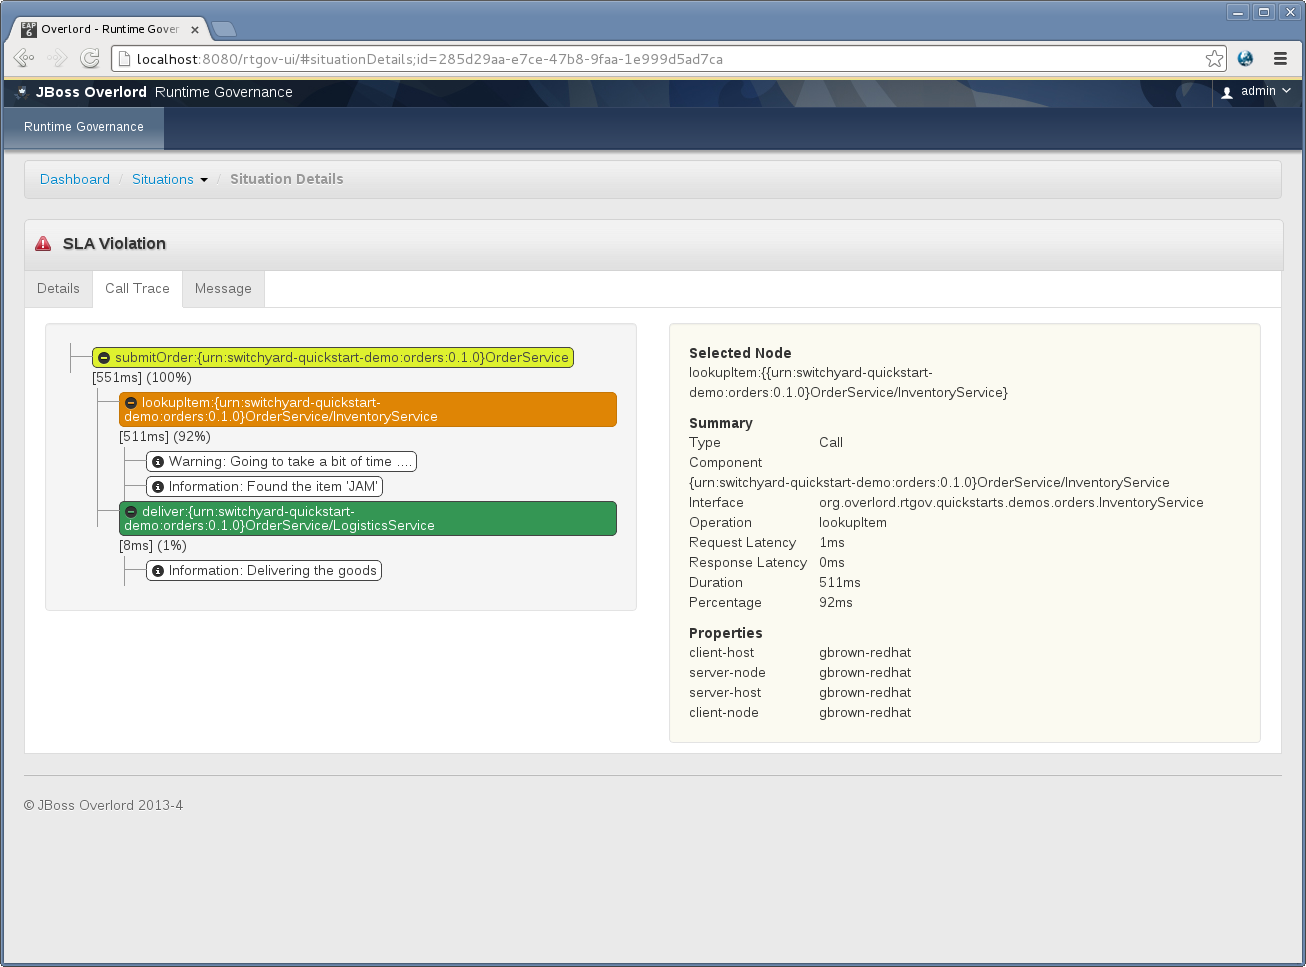
Selecting a node in the call trace displays further details in the right hand panel.
The optional Message tab is displayed if the Situation has an associated business message.
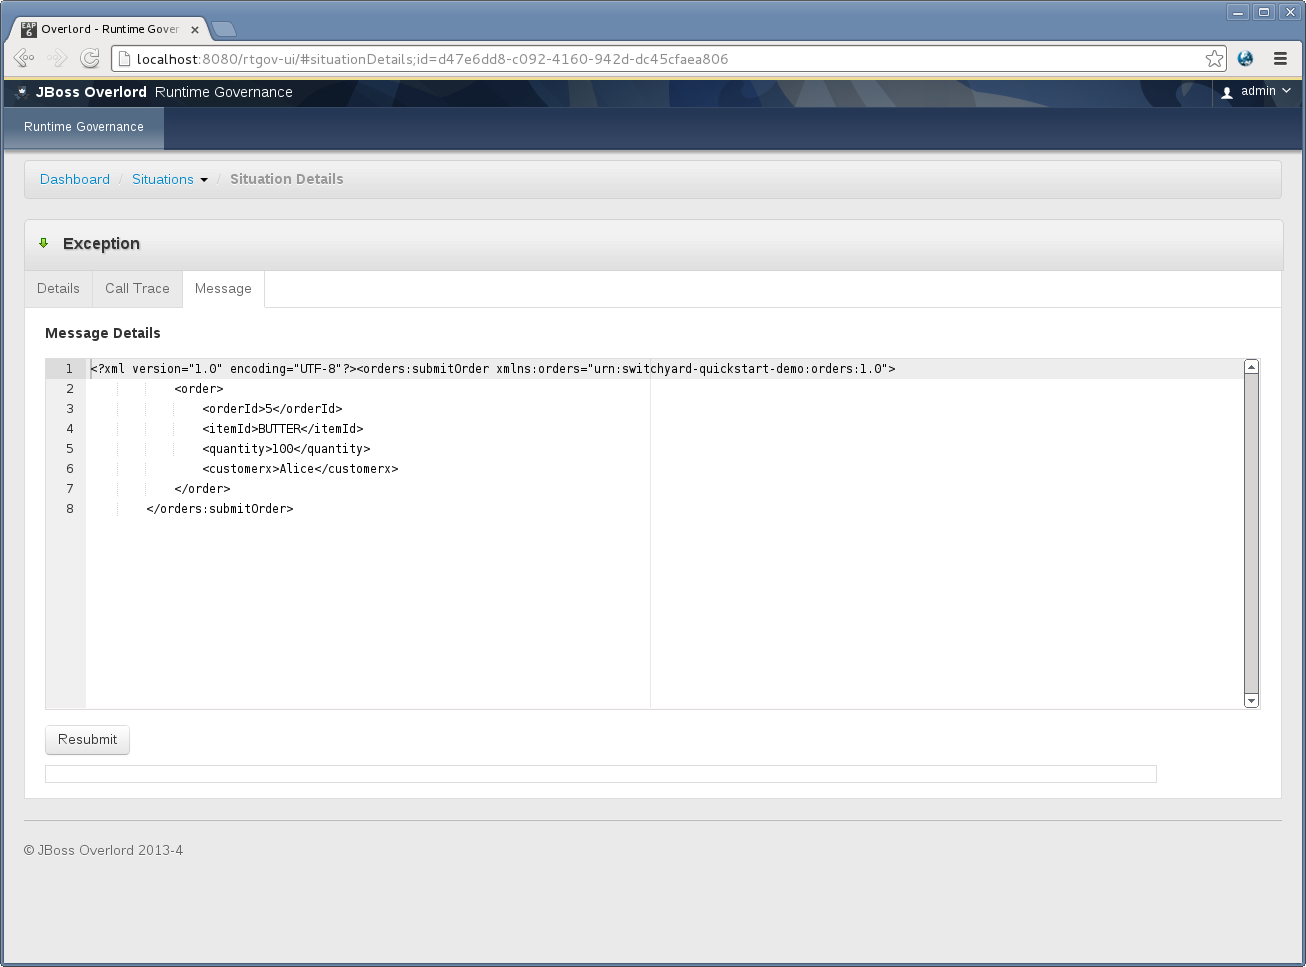
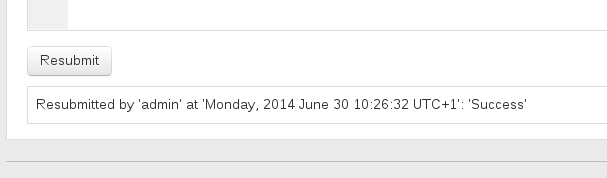
If the service and operation, associated with the situation, supports resubmission of the messages (i.e. if a SwitchYard service, then it would need to have an SCA binding and the operation would need to be one-way), and the Situation is not in a RESOLVED state, then the user will be able to edit the message content and press the Resubmit button. This will result in resubmission information being displayed:
The following diagram shows the lifecycle of a Situation. Transitions are controlled by the outcome of a resubmission associated with the situation, or appropriate buttons presented when viewing the situation details (if manual resolution is permitted).
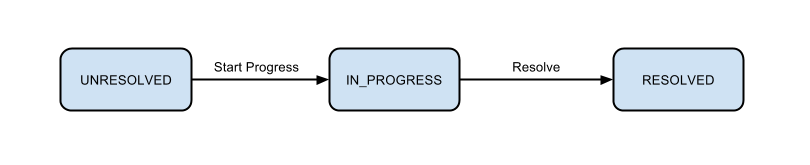
When a resubmission is performed, the outcome of the resubmission will be used to determine whether the associated Situation can be automatically marked as RESOLVED (if successful) or IN_PROGRESS (if unsuccessful).
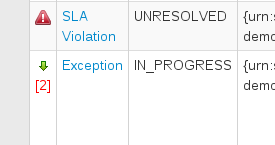
Any subsequent situations created as a result of a resubmission failure will be associated with the Situation that was resubmitted, effectively creating a tree of Situations (i.e. subsequent resubmission failures will then be defined as further nodes in the tree). However, only the top level Situation will be shown within the list of situations.
To indicate which of the situations in the list have associated Situations (due to resubmission failures), a numerical value will be placed in the first column:
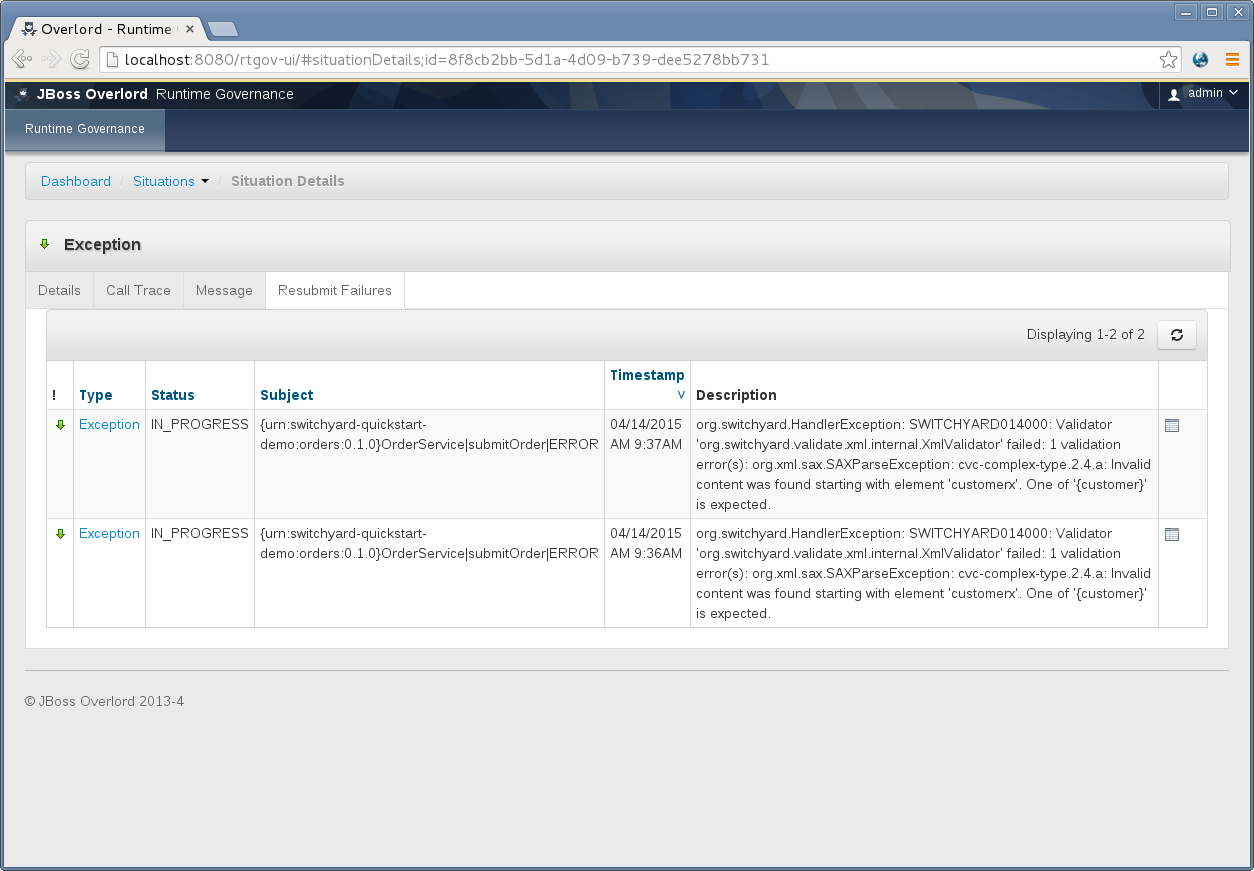
When selecting the details page for such a Situation, there will appear a new tab called Resubmit Failures, listing all of the situations directly or indirectly contained by the selected Situation (i.e. a flattened tree).
RTGov uses Elasticsearch to store the activity information, and Kibana to provide a dashboard for analysing that information.
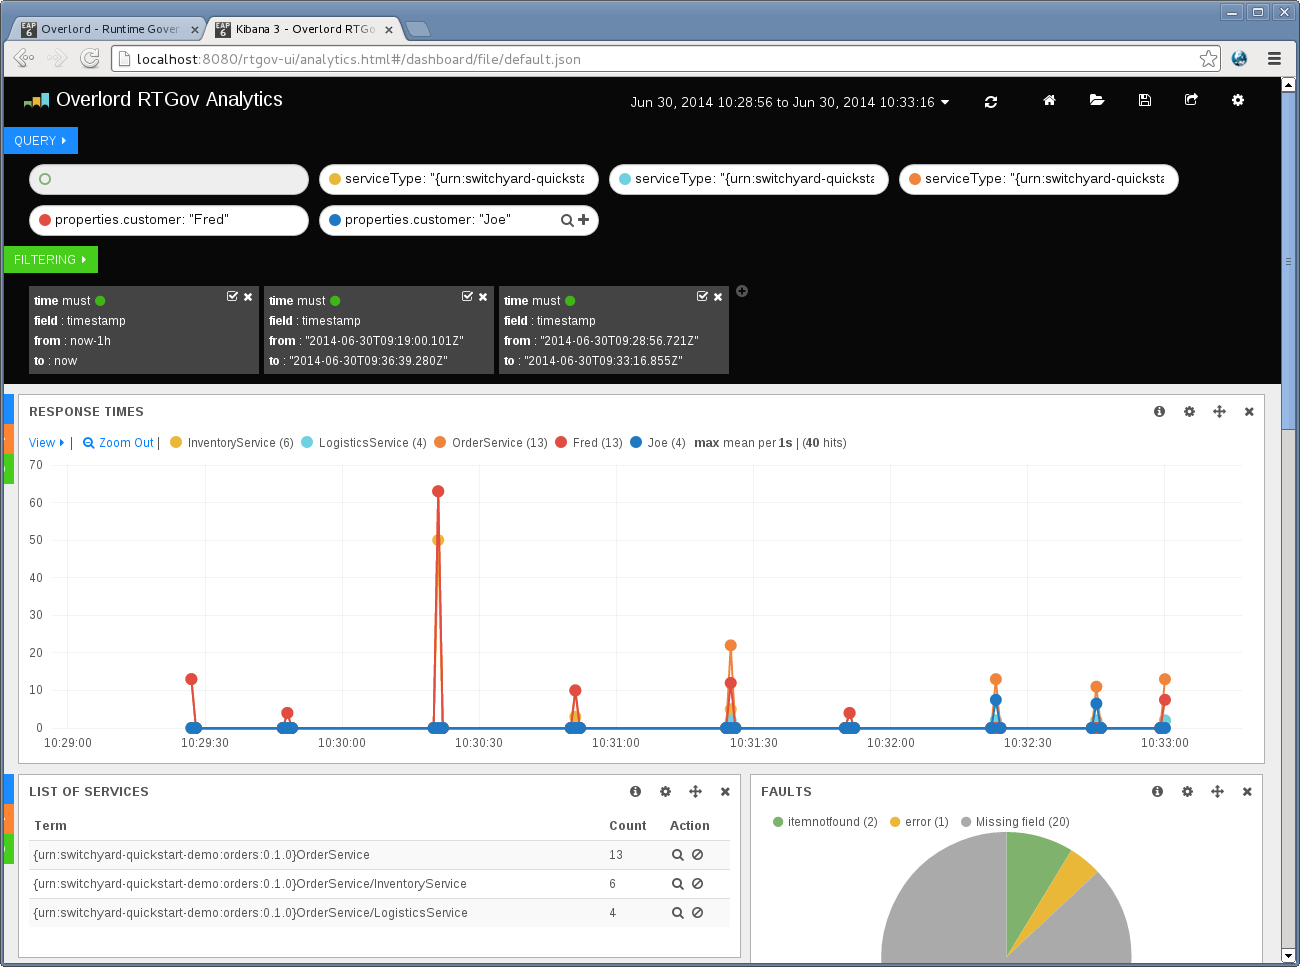
The "out of the box" dashboard layout presents the following information:
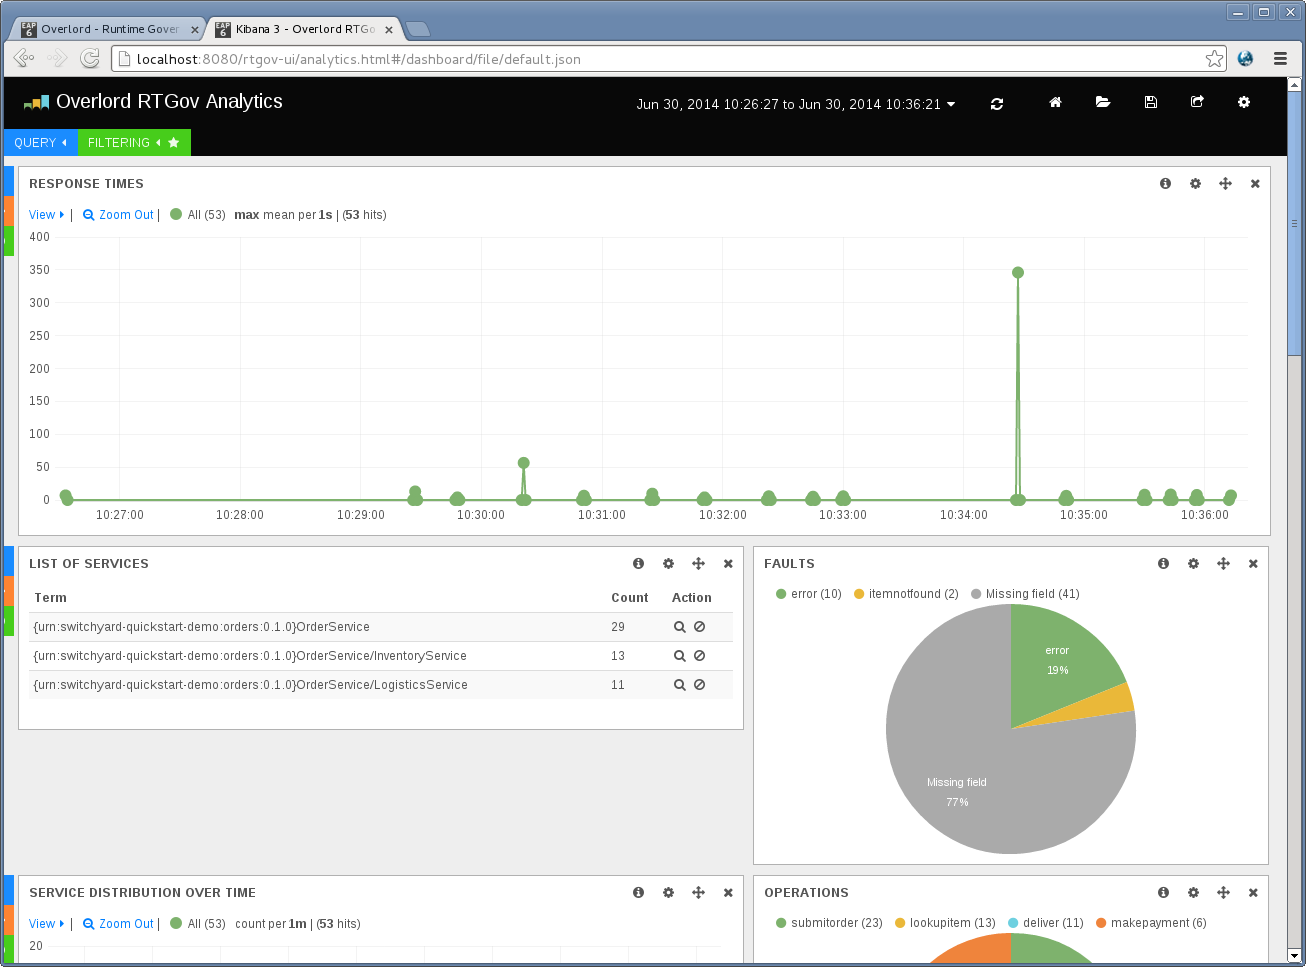
This graph displays response time information that matches any defined filter. Initially the only filter that is applied is a default time frame showing information over the last 24 hours (see following section on Changing the Time Frame and Refresh Cycle).
All response time information will be shown in the same (green) colour. This enables a general indication of performance to be obtained, but to identify specific issues it will be necessary to isolate response times of interest. This can be achieved using "Filtering by query" to only show response times within a particular range.
It is also possible to colour code response time information associated with particular subsets of the information (e.g. for particular service types, or customers, etc). See Segmenting information by query section for more information.
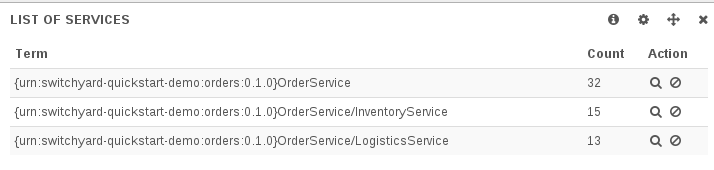
This table shows the list of services. Each service is listed with the number of invocations (count) and actions that can be used to focus or exclude the particular service from the information being viewed.
Note
The service invocation count is based on the information available after all filters have been applied. This means it is possible to identify how many invocations of a particular service have been performed by setting the timeframe (see Changing the Time Frame and Refresh Cycle) or filters on other properties (e.g. customer, host, etc).
By default, the services listed in the table are related to public services. However if a service is marked as internal, then they will be excluded using the following filter:
To include the internal services in the service table, simply disable this filter by unchecking the filter.
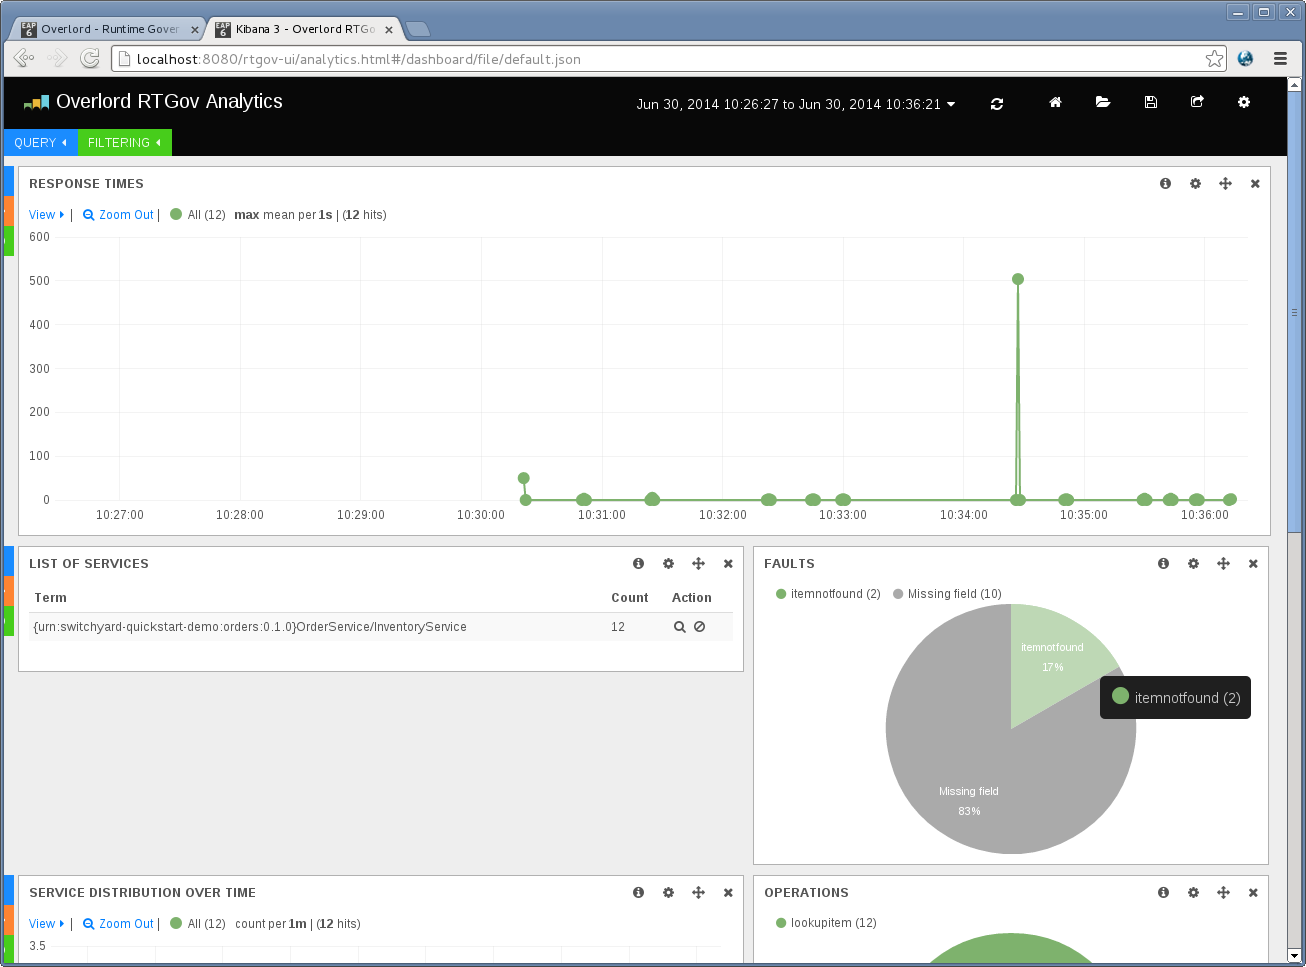
This pie chart shows the distribution of faults that occur within the filtered response time information being viewed.
The segment labels mean:
- "Missing field" refers to response time information that had no associated fault
- "Error" is a general segment to identify response times associated with unnamed exceptions
- All other values are domain specific fault types (e.g. itemnotfound in this case).
Selecting a region from the pie chart will further focus the dashboard on response time information associated with that catagory of fault. To cancel the filter, select the "FILTERING" green tab at the top of the page, and either disable or remove the entry matching the fault filter.
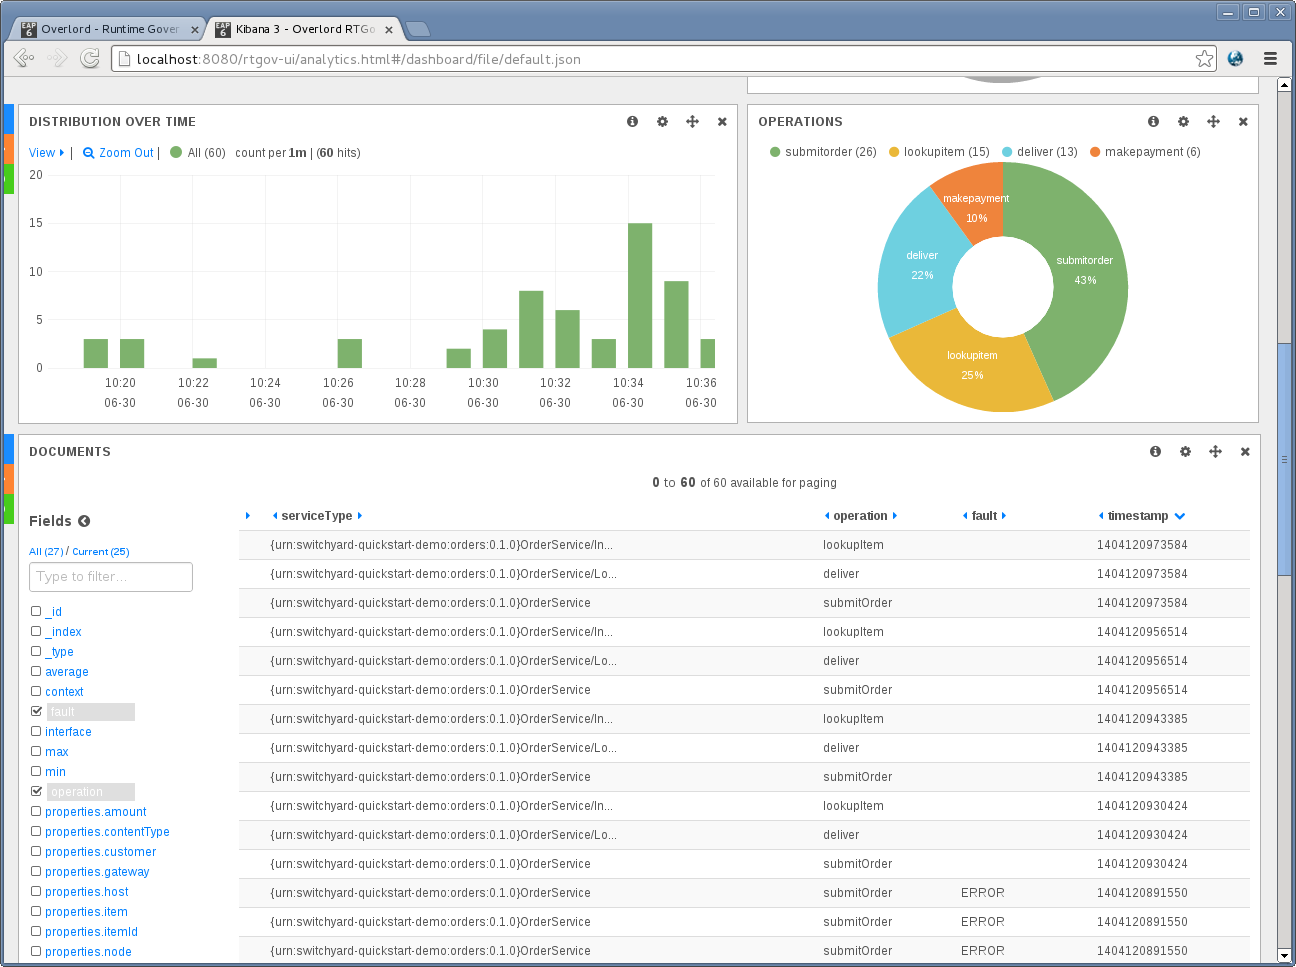
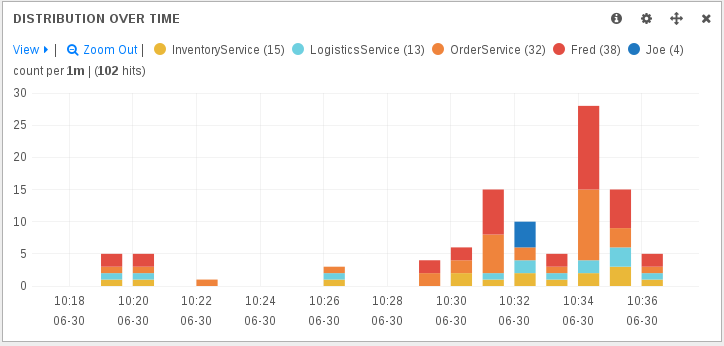
This bar charts shows the distribution of the response time information over time, grouped by a specified time interval (initially 1 minute).
When subsets of information are defined, based on pinned queries, it is possible to get more interesting results based on colour coded regions. For example, if separate queries are used to represent response times associated with different service types, then the bars will be colour coded to show how much activity occurred on each of the service types.
This pie chart is used to decompose the activities based on the operations that were performed, subject to any other filters that may have been applied.
It is also possible to create an additional filter on the currently viewed information, based on a particular operation, by selecting the operation of interest’s segment within the pie chart. To cancel the filter, simply select the "FILTERING" green tab at the top of the page, and either disable or remove the entry matching the operation filter.
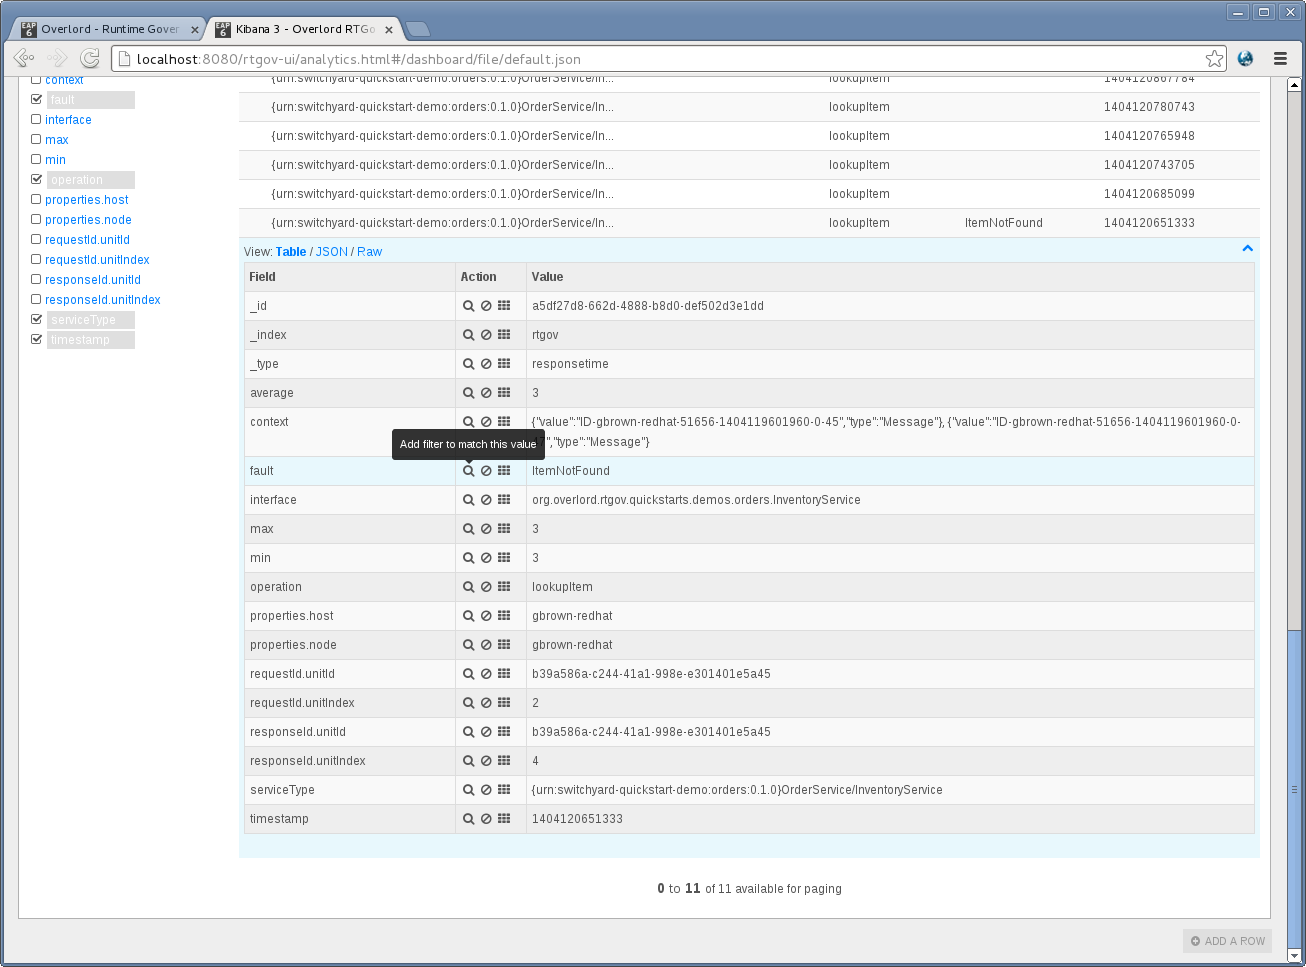
This section provides a list of the most recent response time information. The columns provide a small selection of fields from the response time events, with a list of the available fields as checkboxes down the left hand side. This enables the user to select additional fields of interest.
When a row is selected, it will expand to show the complete set of fields from the response time event, with some action icons next to each value. If the user selects the magnifying glass, then the dashboard will be additional focused on response time information associated with that field value, and similarly selecting the no entry sign will exclude information with that field value.
As mentioned previously, cancelling a particular filter can be achieved by selecting the "FILTERING" green tab at the top of the page, and either disable or remove the entry matching the field filter.
The Kibana dashboard provides a mechanism for users to define the timeframe of interest, and the refresh interval.
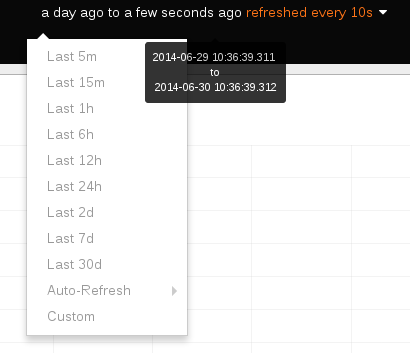
The drop down menu at the top of the dashboard enables the user to select from a default set of time ranges in the past to the current time. If one of the default time ranges is not suitable, then a custom value can be selected.
Similarly, the refresh cycle can be selected from the values in the Auto-Refresh sub-menu, or alternatively disabled by selecting Off.
However it is also possible to interactively select a region from the response time graph (at the top of the page), to focus the attention of the dashboard on that time period. This creates a time based filter, which can be cancelled by selecting the "FILTERING" green tab at the top of the page, and either disable or remove the entry matching the time filter.
The Kibana dashboard enables a user to filter the information being viewed by:
- pressing the magnifying glass symbol associated with some information of interest (see action in the image below)
- pressing the no entry sign symbol associated with the information to be excluded (see action in the image above)
- selecting the information of interest from a pie chart (e.g. selecting a fault, as shown in the image below)
As well as being able to focus/exclude information based on the other graphs, the Documents table provides even more fine grained control over what is displayed. In the following image it shows how the fault value of itemnotfound could be used as a filter, instead of selecting it from the pie chart. However, more importantly adhoc fields such as customer or productName could be equally used as the subject of the filter, if that information is recorded with the activity events (and therefore the response time data).
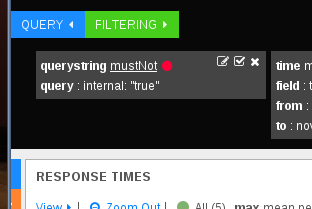
As each filter is added, to progressively refine the results being viewed, their details are listed in the "FILTERING" section at the top of the dashboard, as shown in the following image:
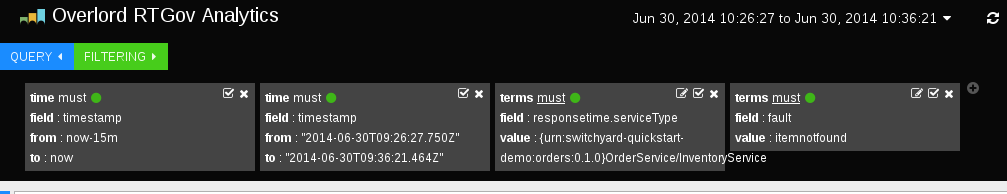
The first box identifies the initial time range used to display the data, which has been refined by the next box based on interactively selecting a region on the response time graph. The third box applies a filter to only show information related to the InventoryService service type, and finally the fourth box narrows the information further to show the subset of response time information associated with the itemnotfound fault.
Any of the these filter criteria can individually be disabled (using the tick symbol) or cancelled (using the cross symbol).
Although filtering provides a useful way to narrow in on information of interest to view that data in the available graphs. It is sometimes more interesting to be able to compare different sets of results.
In the default dashboard all response time information is treated in the same way, and therefore not differentiated. If we want to segment the information based on various groupings, then we need to create what are called pinned queries. At the top of the dashboard, you will need to expand the blue "QUERY" region to find a data entry area. This can be used to enter adhoc queries to filter the results displayed in the dashboard (see following section).
However for the purpose of comparing different sets of data, we leave the default entry blank and instead create one or more additional query fields, but pressing the plus symbol present in the last entry field.
When an entry field has been created, enter an appropriate query. For example,
-
serviceType: "{urn:switchyard-quickstart-demo-orders:0.1.0}OrderService/InventoryService"
This query will identify response times associated with the InventoryService service type.
-
properties.customer: "Fred"
If the customer name has been associated with the reported activity events, then this query will identify the response time information associated with a particular customer.
As shown in the following image, the colour coded segmented queries are reflected in the response time graph:
as well as the Distribution over time chart:
To change the label associated with a query, select the query coloured dot and enter the label in the field, followed by pressing the close button:
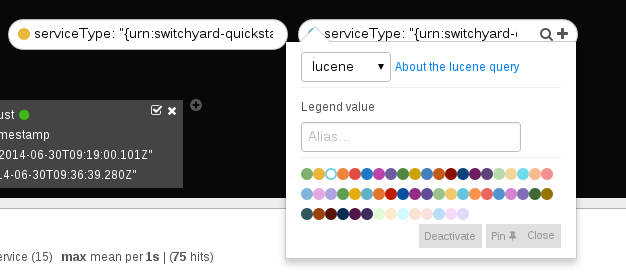
It is also possible to temporarily disable a particular query, or change its colour, using this popup dialog.
Some times we need to focus the information on a particular property value or range. For example, if wanting to identify the services involved in increased response times, to locate potential performance issues, then enter the query "max:>100" to show all response times that are greater than 100 milliseconds:
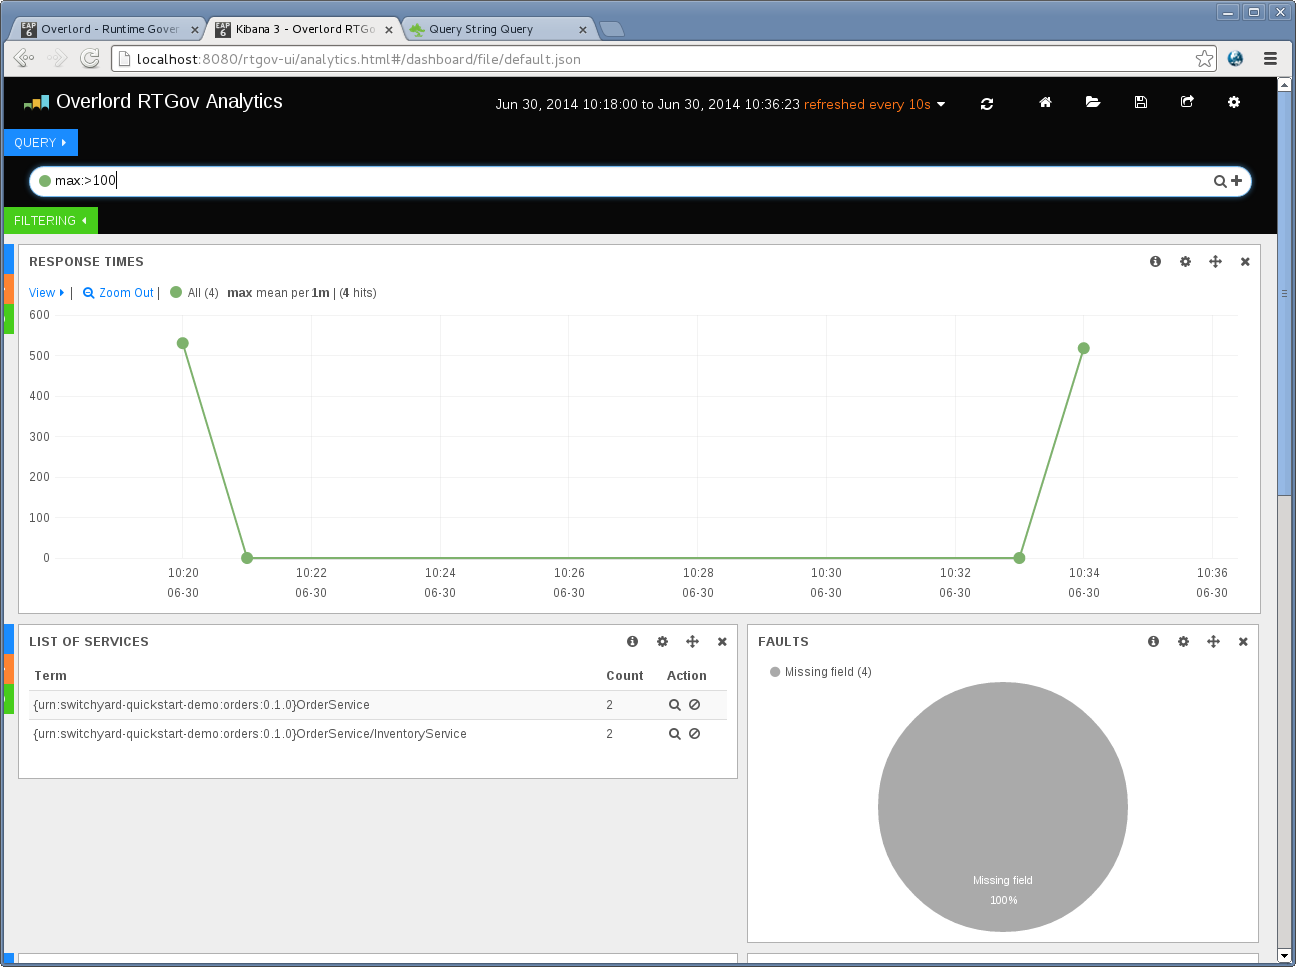
Notice that the List of Services table now only includes the list of services that are related to those higher response times. The same applies to the Operations pie chart lower in the page. This can be used to pin point the services and operations that are causing the performance problems - and also by examining the Documents it is possible to identify other useful information, such as which customer was affected (if that information has been recorded with the activity events).
It is possible to customise the dashboard, adding/removing rows and widgets within rows, configuring the graphs/charts/tables, etc.
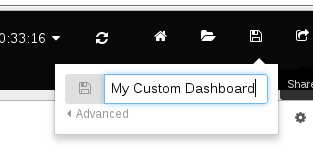
Once a custom dashboard has been defined, then it can be saved using the disc symbol at the top right of the dashboard:
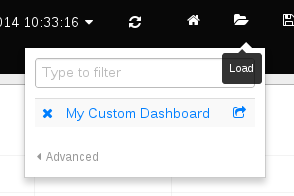
When relaunching the RTGov UI, it is the possible to load a custom dashboard using:
It is also possible to export a custom dasbboard to a file, enabling it to be distributed to other interested users, who can then import it into their user account. Select the save icon, select Advanced and then Export Schema.