This example, located in the samples/slamonitor folder, demonstrates an approach to provide "Service Level Agreement" monitoring. This example makes uses of the example Switchyard application located in the samples/ordermgmt folder.
This example will show how:
-
activity event analysis, using the Event Processor Network mechanism, can be used to implement Service Level Agreements
- uses the Complex Event Processing (CEP) based event processor (using Drools Fusion)
-
impending or actual SLA violations can be reported for the attention of end users, via
- JMX notifications
- REST service
- to build a custom application to access the analysis results (see child page)
This example shows a simple Service Level Agreement that checks whether a service response time exceeds expected levels. The CEP rule detects whether a situation of interest has occurred, and if so, creates a org.overlord.rtgov.analytics.Situation object and initializes it with the appropriate description/severity information, before forwarding it back into the EPN. This results in the "Situation" object being published as a notification on the "Situations" subject.
The CEP rule is:
import org.overlord.rtgov.analytics.service.ResponseTime
import org.overlord.rtgov.analytics.Situation

global org.overlord.rtgov.ep.EPContext epc

declare ResponseTime
    @role( event )
end

rule "check for SLA violations"
when
    $rt : ResponseTime() from entry-point "ServiceResponseTimes"
then

        if ($rt.getAverage() > 200) {
                epc.logError("\r\n\r\n**** RESPONSE TIME "+$rt.getAverage()+"ms EXCEEDED SLA FOR "+$rt.getServiceType()+" ****\r\n");

                Situation situation=new Situation();

                situation.setType("SLA Violation");
                situation.setSubject($rt.getServiceType()+"/"+$rt.getOperation());
                situation.setTimestamp(System.currentTimeMillis());

                situation.getProperties().putAll($rt.getProperties());

                if ($rt.getRequestId() != null) {
                        situation.getActivityTypeIds().add($rt.getRequestId());
                }
                if ($rt.getResponseId() != null) {
                        situation.getActivityTypeIds().add($rt.getResponseId());
                }

                situation.getContext().addAll($rt.getContext());

                String serviceName=$rt.getServiceType();

                if (serviceName.startsWith("{")) {
                        serviceName = javax.xml.namespace.QName.valueOf(serviceName).getLocalPart();
                }

                if ($rt.getAverage() > 400) {
                        situation.setDescription(serviceName+" exceeded maximum response time of 400 ms");
                        situation.setSeverity(Situation.Severity.Critical);
                } else if ($rt.getAverage() > 320) {
                        situation.setDescription(serviceName+" exceeded response time of 320 ms");
                        situation.setSeverity(Situation.Severity.High);
                } else if ($rt.getAverage() > 260) {
                        situation.setDescription(serviceName+" exceeded response time of 260 ms");
                        situation.setSeverity(Situation.Severity.Medium);
                } else {
                        situation.setDescription(serviceName+" exceeded response time of 200 ms");
                        situation.setSeverity(Situation.Severity.Low);
                }

                epc.handle(situation);
        }

end
The "out of the box" active collection configuration is pre-initialized with a collection for the org.overlord.rtgov.analytics.Situation objects, subscribing to the "Situations" subject from the Event Processor Network. Therefore any detected SLA violations will automatically be stored in this collection (accessible via a RESTful service), and reported to the associated JMX notifier.
To install the example, simply set the JBOSS_HOME environment variable to the location of your switchyard installation (download from the latest switchyard-as7 zip from https://www.jboss.org/switchyard/downloads).
Then open a command window, set the current working directory to the ${rtgov}/samples/ordermgmt folder, and run:
mvn clean install
Then change to the ${rtgov}/samples/slamonitor folder and run the same command again.
To run the example, the first step is to start the Switchyard server using the following command from the bin folder:
./standalone.sh --server-config=standalone-full.xml
Once the server has fully started, then send the following message (using SOAP-UI or an equivalent SOAP client) to: http://localhost:8080/demo-orders/OrderService
<soap:Envelope xmlns:soap="http://schemas.xmlsoap.org/soap/envelope/">
   <soap:Body>
      <orders:submitOrder xmlns:orders="urn:switchyard-quickstart-demo:orders:1.0">
         <order>
            <orderId>PO-19838-XYZ</orderId>
            <itemId>JAM</itemId>
            <quantity>400</quantity>
            <customer>Fred</customer>
         </order>
      </orders:submitOrder>
   </soap:Body>
</soap:Envelope>
The itemId of "JAM" causes a delay to be introduced in the service, resulting in a SLA violation being detected. This violation can be viewed using two approaches:
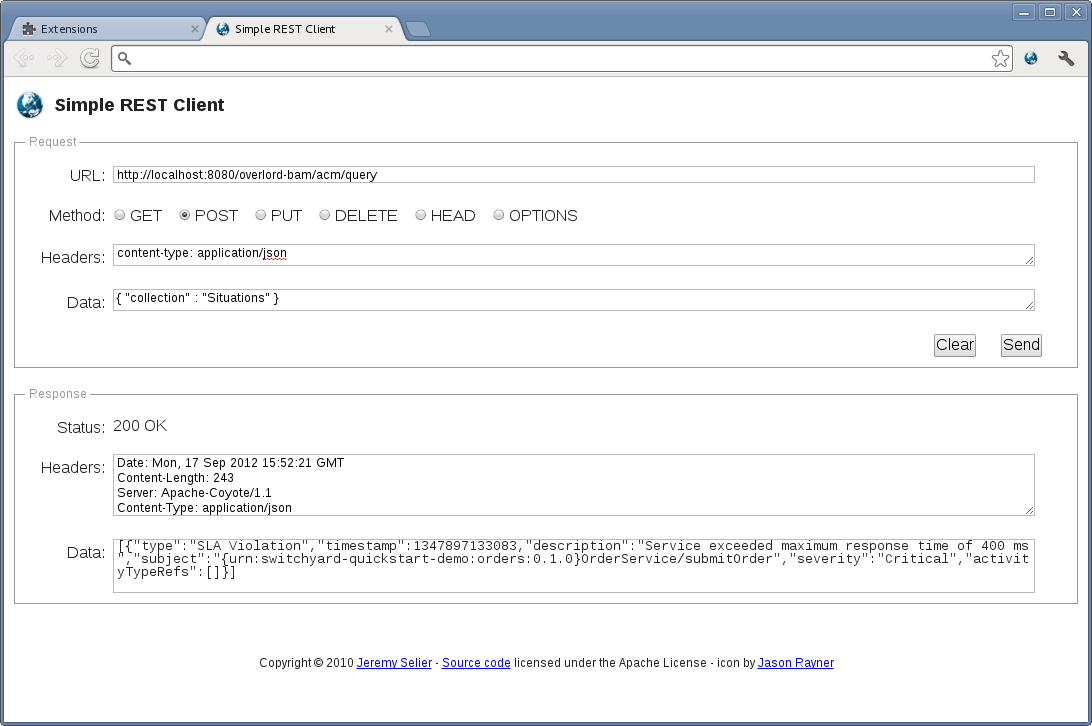
Using a suitable REST client, sent the following POST to: http://localhost:8080/overlord-rtgov/acm/query (using content-type of "application/json")
{
    "collection" : "Situations"
}
This will result in the following response:
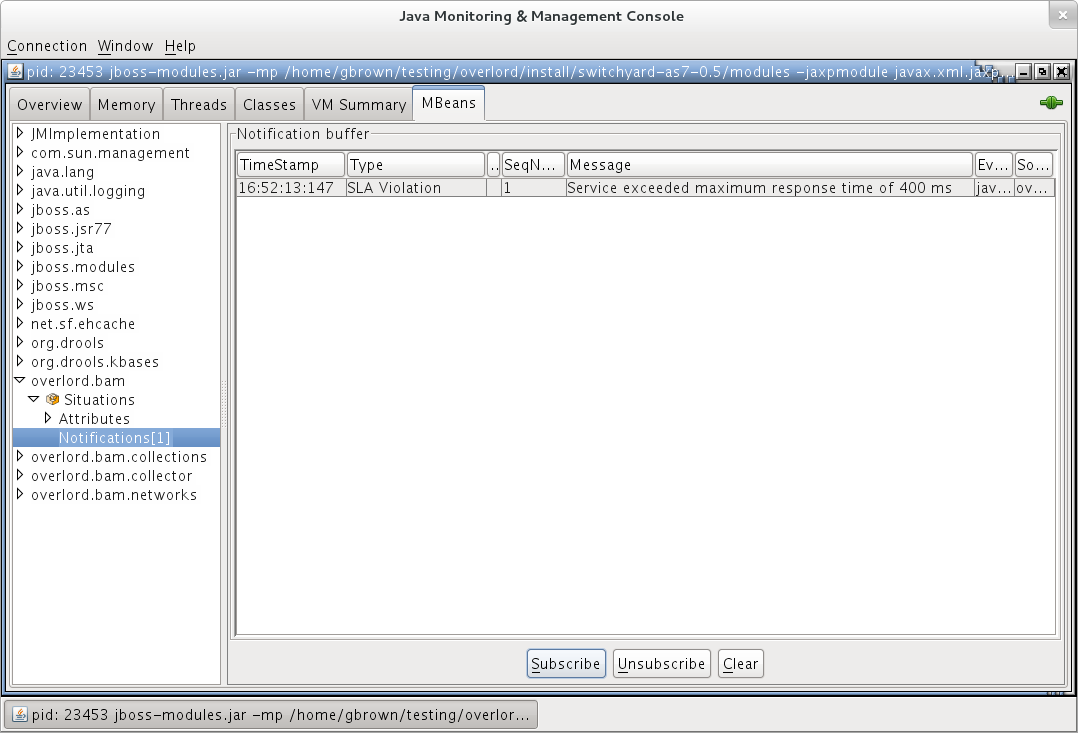
The Situations active collection source also generates JMX notifications that can be subscribed to using a suitable JMX management application. For example, using JConsole we can view the SLA violation:
As well as having access to the information via REST or JMX, it may also be desirable to have more direct access to the active collection results. This section describes the custom app defined in the ${rtgov}/samples/slamonitor/monitor folder.
The following code shows how the custom application initializes access to the relevant active collections:
@Path("/monitor")
@ApplicationScoped
public class SLAMonitor {

    private static final String SERVICE_RESPONSE_TIMES = "ServiceResponseTimes";
    private static final String SITUATIONS = "Situations";

    private static final Logger LOG=Logger.getLogger(SLAMonitor.class.getName());

    private static final String ACM_MANAGER = "java:global/overlord-rtgov/ActiveCollectionManager";

    private ActiveCollectionManager _acmManager=null;
    private ActiveList _serviceResponseTime=null;
    private ActiveList _situations=null;

    /**
     * This is the default constructor.
     */
    public SLAMonitor() {

        try {
            InitialContext ctx=new InitialContext();

            _acmManager = (ActiveCollectionManager)ctx.lookup(ACM_MANAGER);

            _serviceResponseTime = (ActiveList)
                    _acmManager.getActiveCollection(SERVICE_RESPONSE_TIMES);

            _situations = (ActiveList)
                    _acmManager.getActiveCollection(SITUATIONS);

        } catch (Exception e) {
            LOG.log(Level.SEVERE, "Failed to initialize active collection manager", e);
        }

    }
Then when the REST request is received (e.g. for SLA violations defined as Situations),
    @GET
    @Path("/situations")
    @Produces("application/json")
    public java.util.List<Situation> getSituations() {
        java.util.List<Situation> ret=new java.util.ArrayList<Situation>();

        for (Object obj : _situations) {
            if (obj instanceof Situation) {
                ret.add((Situation)obj);
            }
        }

        return (ret);
    }
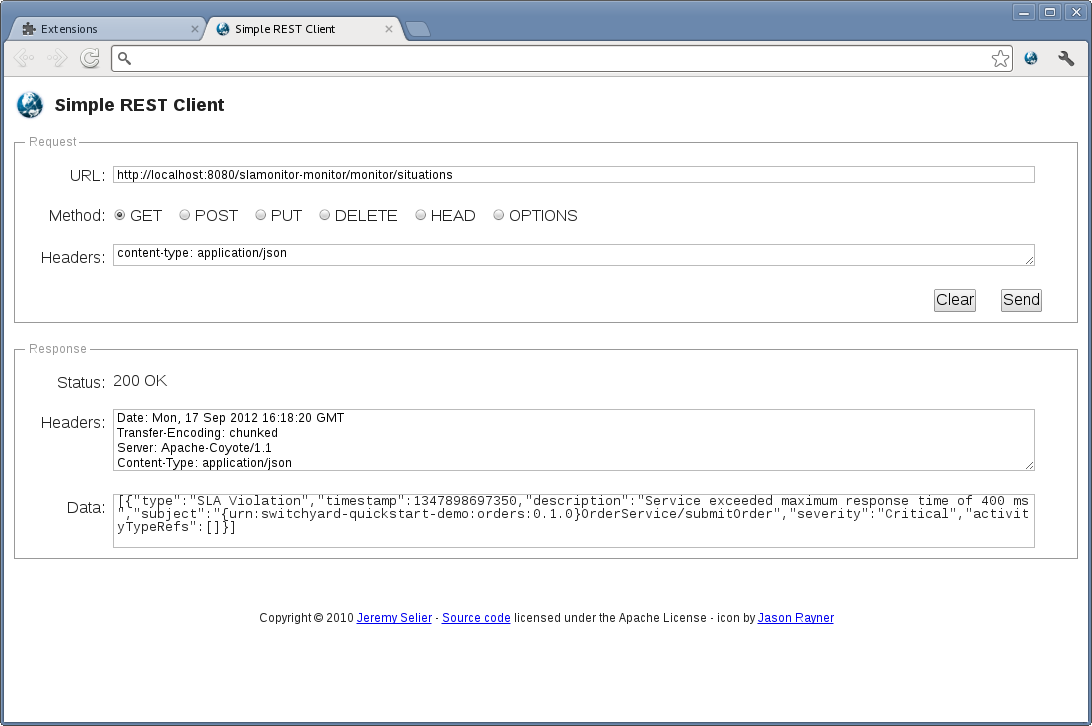
To see the SLA violations, send a REST GET request to: http://localhost:8080/slamonitor-monitor/monitor/situations
This will return the following information:
It is also possible to request the list of response time information from the same custom service, using the URL: http://localhost:8080/slamonitor-monitor/monitor/responseTimes?operation=submitOrder
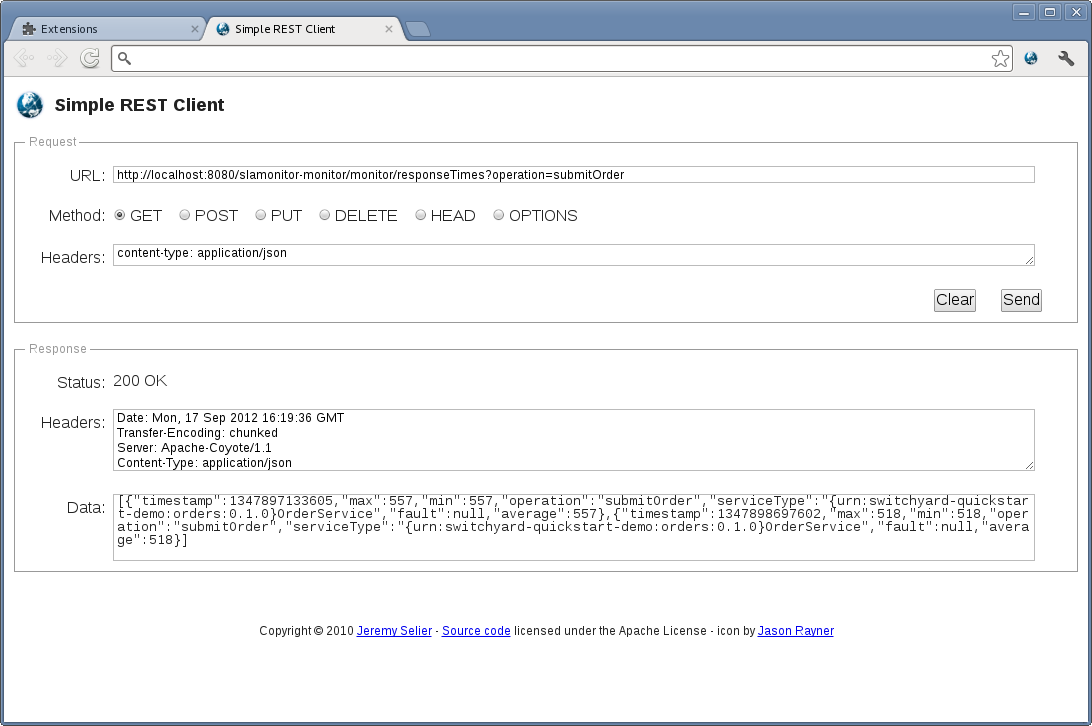
Caution
If no query parameter is provided, then response times for all operations will be returned.
This quickstart demonstrates how Service Level Agreements can be policed using rules defined in an Event Processor Network, and reporting to end users using the pre-configured "Situations" active collection.
The rule used in this example is simple, detecting whether the response time associated with an operation on a service exceeds a particular level. However more complex temporal rules could be defined to identify the latency between any two points in a business transaction flow.