Overview
Monitoring is one of the largest subsystems in RHQ. It's primary focus is to gather data (called "metrics" or "measurements") from each of the resources in inventory. It can graph this data for better visualization of your system behavior.
Monitoring also has the richest integration with the RHQ alerts subsystem. You can be notified when specific metric values are reached, when collected metrics fall outside of predetermined ranges or even more complex statistical calculations like "10% higher than the last 24-hr running average for this metric."
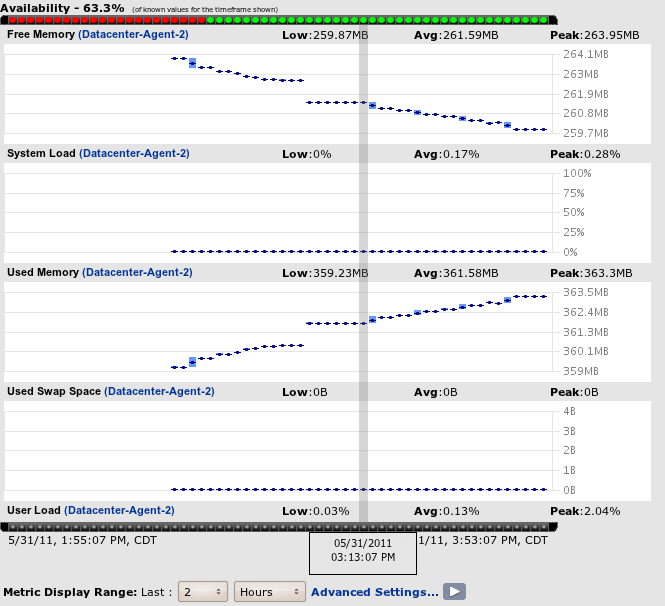
The data RHQ collects depends on the type of server or service being monitored. For instance, if you monitor a Linux platform, you can see metric data about: total, used, and free swap; total, used, shared, and free memory; total, idle, and user CPU; and more. For a Tomcat server instance you can view details such as the JVM total memory, active thread count and thread group count, uptime, process shared memory time, and more.
Concepts
The following are concepts that relate to the monitoring subsystem.
Numeric Measurements / Traits
Any measurement data that can be modeled as a simple numeric or string value can be monitored.
The very nature of numerical data makes it easy to graph and provide visual history for changes to values over time. RHQ calls these numeric measurements or "dynamic metrics". If a numeric measurement monotonically changes (for example, "Number of connections" monotonically increases, never decreases), these are called "trends-up metrics" but are still numeric. Numeric metrics are assumed to be constantly changing.
String-based data, on the other hand, is better represented as a list of changes to the value of that string over time - RHQ calls these "traits". Traits are assumed to be for the most part static values that rarely change. Traits are things like the version number of a piece of software or the hostname of a machine.
Call Time
Call Time metrics (sometimes called "response time" metrics) are a special form of numerical data that attempts to, in a simple way, mimic some of the features you might find in a profiler (even though it should be pointed out that RHQ is not a profiler). Call time data allows, for example, for monitoring of method invocations on EJB calls or the response time of hits to specific URLs hosted by some web server. Only certain types of resources support Call Time metrics.
Before response times can be gathered or displayed, you need to do a few things.
First you need to configure the resource so it can generate calltime data. For some resources (like the EJB service under JBossAS 4 Server resource type), there is nothing extra you need to do. If you want to track HTTP response times in a Tomcat web server, you'll need to add a response time filter inside Tomcat. There are instructions elsewhere in the docs on how to do this for particular resource types (like JBossAS 4, 5, 7 and Tomcat).
You must also configure the calltime connection properties inside RHQ. Again, some resources have nothing to do here, but for others, there are some connection properties you must set in order for calltime data to be collected:
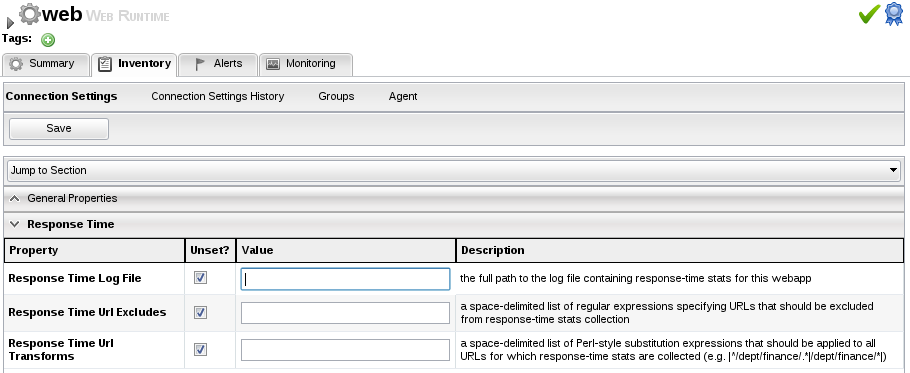
In the above example, you need to give the full path to the response time log file of the web application. You can optionally provide:
-
URL Excludes: you can specify URLs that should not be taken into account for the response time metrics. Examples are static pages like CSS files or favicons. Entries are regular expressions and need to be separated by spaces.
-
URL Transforms: If a page is called with different parameters, you might decide to show them as separate URLs or as one URL only. The transform allows you to rewrite URLs to, for example, strip off those parameters. Entries are regular expressions that are separated by spaces. The functioning of the URL transforms is depending on the settings of the Response Time Filter configuration, specifically the chopQueryString parameter.
Finally, you must enable the metric schedule so it can begin to be collected. Go to a resource's Monitoring>Schedules page and look for the metric schedule whose type is "calltime" (for any resource that supports calltime metrics, there is only one of this type). Enable it like you would any other metric schedule.
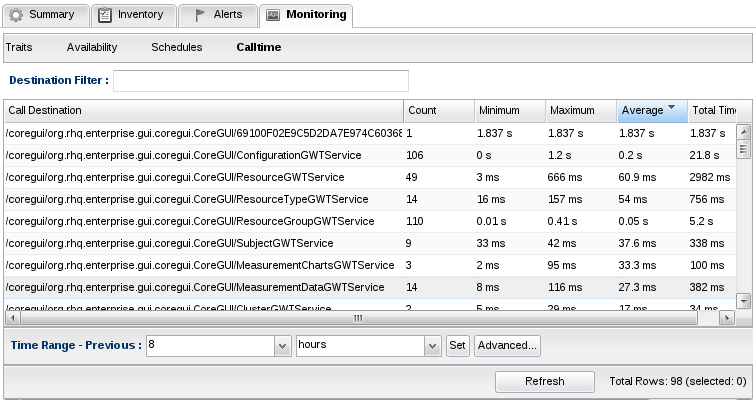
Once enabled, call time data will begin to be collected. You can view the call time data in the Monitoring>Calltime subtab.
Availability
Availability is a special kind of measurement that is collected by RHQ. RHQ will continually check to see what resources are up and what are down. It will maintain a history of availability data for all resources, track things such as their downtime and their number of failures and will compute statistics such as MTBF (Mean Time Between Failures) and MTTR (Mean Time To Recovery).
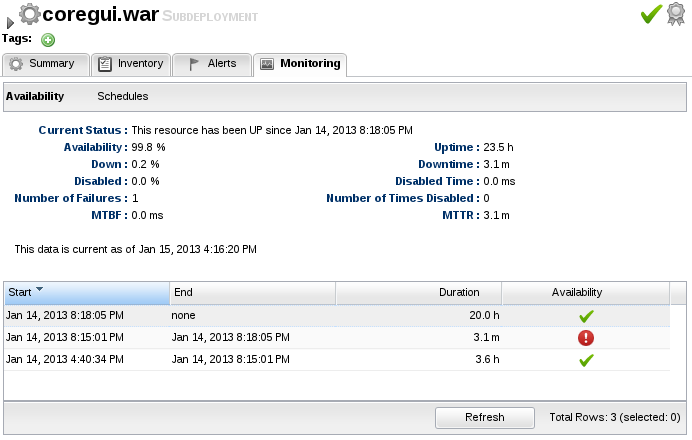
A resource is normally either in one of two states - UP or DOWN. UP is usually denoted with a green checkmark icon and DOWN is usually denoted with red circle icon. A resource that is UP is considered up and running and can be managed by the agent. DOWN resources are considered unmanageable at the current time, usually due to the fact that the resource has been shutdown or is no longer active.
You may also see two other availability states for some resources. UNKNOWN (denoted with a grey question mark icon) indicates the availability for that resource is not known by RHQ at the current time. This is usually due to the agent being down and not reporting availability or it is a newly imported resource and its initial availability has not been received yet by the agent.
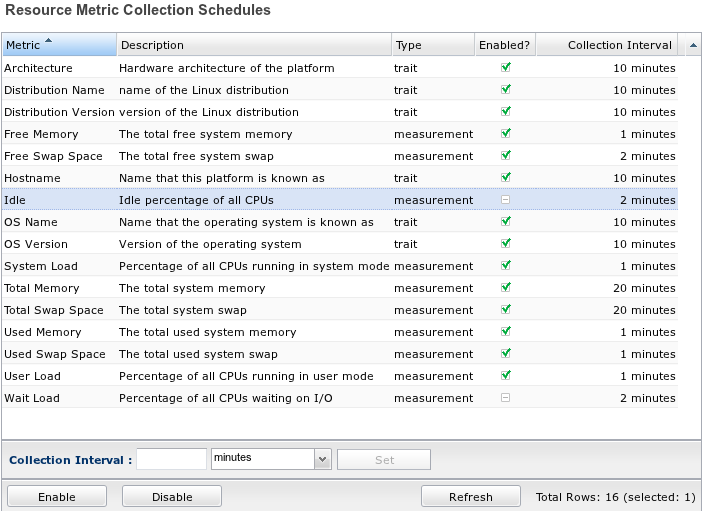
Schedules and Templates
RHQ does collect live data across your entire enterprise but it doesn't do so on a millisecond-by-millisecond or even a second-by-second basis (again, RHQ is not a profiler). If it did this, it would potentially put undo load on your machines, many of which are likely in Production. Instead, RHQ enables each and every piece of metric data it gathers to have its own "schedule" for collection. You can choose to collect data as slow as every hour, or as fast as every 30 seconds, or anything in between. Each schedule can be enabled, disabled, or altered according to the needs of the user wanting RHQ to perform the collection.
When a resource is first created it get a set of default schedules. These defaults are known as metric "templates" in RHQ, and can be edited as well. After changes are made to the templates newly imported resources will have their schedules created with the new defaults. Template changes can optionally trickle down to the schedules already in the system.
Data Storage
RHQ has an intelligent background mechanism working to keep an upper bound on the size of monitoring data stored. Since monitoring data is most useful for managing the current state of the system and responding to perturbations within that current data, RHQ will gradually start to "compress" the raw data it has collected as it ages. This compression mechanism begins only after data is two weeks old up until it's one year old by default, at which point it is completely purged from the system.