This chapter covers the two types of reports that can be generated from the TCK, an assertion coverage report and the test execution results. The chapter also justifies why the TCK is good indicator of how accurately an implementation conforms to the JSR-299 specification.
The CDI TCK coverage has been measured as follows:
Assertion Breadth Coverage
The CDI TCK provides at least 75% coverage of identified assertions with test cases.
Assertion Breadth Coverage Variance
The coverage of specification sub-sections shows at 75% of sections with greater than 75% coverage.
Assertion Depth Coverage
The assertion depth coverage has not been measured, as, when an assertion requires more than one testcase, these have been enumerated in an assertion group and so are adequately described by the assertion breadth coverage.
API Signature Coverage
The CDI TCK covers 100% of all API public methods using the Java CTT Sig Test tool.
A specification can be distilled into a collection of assertions that define the behavior of the software. This section introduces the CDI TCK coverage report, which documents the relationship between the assertions that have been identified in the JSR-299 specification document and the tests in the TCK test suite.
The structure of this report is controlled by the assertion document, so we'll start there.
The CDI TCK developers have analyzed the JSR-299 specification document and identified the assertions that are present in each chapter. Here's an example of one such assertion found in section 2.3.3:
A bean may declare multiple binding types.
The assertions are listed in the XML file impl/src/main/resources/tck-audit.xml in the CDI TCK distribution. Each assertion is identified by the section of the specification document in which it resides and assigned a unique paragraph identifier to narrow down the location of the assertion further. To continue with the example, the assertion shown above is listed in the tck-audit.xml file using this XML fragment:
<section id="2.3.3" title="Declare the bindings of a bean">

  ...

  <assertion id="d">

     <text>A bean may declare multiple binding types.</type>

  </assertion>

  ...

</section>
The strategy of the CDI TCK is to write a test which validates this
assertion when run against an implementation. A test case (a method
annotated with @Test in an
@Artifact class) is correlated with an assertion
using the
@org.jboss.test.audit.annotations.SpecAssertion
annotation as follows:
@Test

@SpecAssertion(section = "2.3.3", id = "d")

public void testMultipleBindings()

{

  Bean<?> model = getBeans(Cod.class, new ChunkyBinding(true), new WhitefishBinding()).iterator().next();

  assert model.getBindings().size() == 3;

}
To help evaluate the distribution of coverage for these assertions, the TCK provides a detailed coverage report. This report is also useful to help implementors match tests with the language in the specification that supports the behavior being tested.
The coverage report is an HTML report generated as part of the TCK project build. Specifically, it is generated by an annotation processor that attaches to the compilation of the classes in the TCK test suite, another tool from the JBoss Test Utils project. The report is only generated when using Java 6 or above, as it requires the annotation processor.
mvn clean install
Note
You must run clean first because the annotation processor performs it's work when the test class is being compiled. If compilation is unnecessary, then the assertions referenced in that class will not be discovered.
The report is written to the file target/coverage.html in the same project. The report has five sections:
Chapter Summary - List the chapters (that contain assertions) in the specification document along with total assertions, tests and coverage percentage.
Section Summary - Lists the sections (that contain assertions) in the specification document along with total assertions, tests and coverage percentage.
Coverage Detail - Each assertion and the test that covers it, if any.
Unmatched Tests - A list of tests for which there is no matching assertion (useful during TCK development).
Unversioned Tests - A list of tests for which there is no
@SpecVersionannotation on the test class (useful during TCK development).
The coverage report is color coded to indicate the status of an assertion, or group of assertions. The status codes are as follows:
Covered - a test exists for this assertion
Not covered - no test exists for this assertion
Problematic - a test exists, but is currently disabled. For example, this may be because the test is under development
Untestable - the assertion has been deemed untestable, a note, explaining why, is normally provided
For reasons provided in the tck-audit.xml document and presented in
the coverage report, some assertions are not testable.
The coverage report does not give any indication as to whether the tests are passing. That's where the TestNG reports come in.
As you by now, the CDI TCK test suite is really just a TestNG test suite. That means an execution of the CDI TCK test suite produces all the same reports that TestNG produces. This section will go over those reports and show you were to go to find each of them.
When the CDI TCK test suite is executed during the Maven 2 test phase of the TCK runner project, TestNG is invoked indirectly through the Maven Surefire plugin. Surefire is a test execution abstraction layer capable of executing a mix of tests written for JUnit, TestNG, and other supported test frameworks.
Why is this relevant? It means two things. First, it means that you are going to get a summary of the test run on the commandline. Here's the output generated when the tests are run using standalone mode.
-------------------------------------------------------
 T E S T S
-------------------------------------------------------
Running TestSuite
[XmlMethodSelector] CLASSNAME:org.jboss.testharness.impl.testng.DisableIntegrationTestsMethodSelector
[XmlMethodSelector] SETTING PRIORITY:0
[XmlMethodSelector] CLASSNAME:org.jboss.testharness.impl.testng.ExcludeIncontainerUnderInvestigationMethodSelector
[XmlMethodSelector] SETTING PRIORITY:0
Tests run: 441, Failures: 0, Errors: 0, Skipped: 0, Time elapsed: 22.816 sec

Results :

Tests run: 441, Failures: 0, Errors: 0, Skipped: 0
Note
The number of tests executed, the execution time, and the output will differ when you run the tests using in-container mode as the CDI TCK requires.
If the Maven reporting plugin that compliments Surefire is configured properly, Maven will also generate a generic HTML test result report. That report is written to the file test-report.html in the target/surefire-reports directory of the TCK runner project. It shows how many tests were run, how many failed and the success rate of the test run.
The one drawback of the Maven Surefire report plugin is that it buffers the test failures and puts them in the HTML report rather than outputting them to the commandline. If you are running the test suite to determine if there are any failures, it may be more useful to get this information in the foreground. You can prevent the failures from being redirected to the report using the following commandline switch:
mvn test -Dsurefire.useFile=false
The information that the Surefire provides is fairly basic and the detail pales in comparison to what the native TestNG reports provide.
TestNG produces several HTML reports for a given test run. All the reports can be found in the target/surefire-reports directory in the TCK runner project. Below is a list of the three types of reports:
Test Summary Report
Test Suite Detail Report
Emailable Report
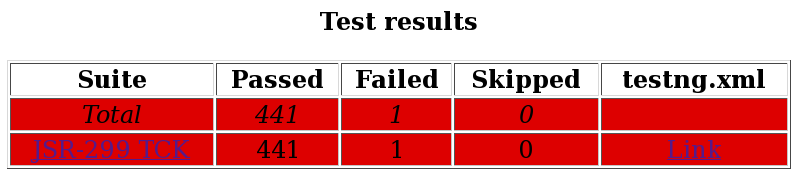
The first report, the test summary report, show below, is written to the file index.html. It produces the same information as the generic Surefire report.
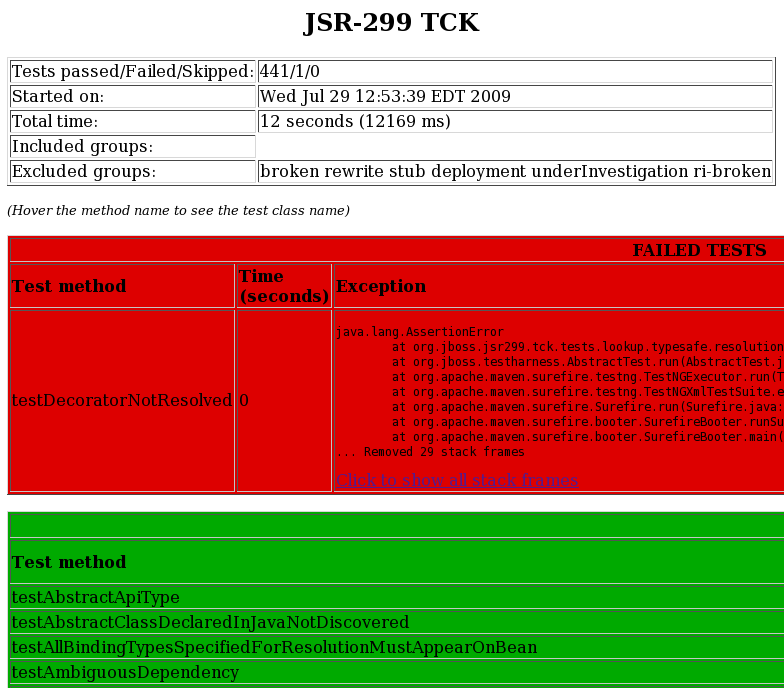
The summary report links to the test suite detail report, which has a wealth of information. It shows a complete list of test groups along with the classes in each group, which groups were included and excluded, and any exceptions that were raised, whether from a passed or failed test. A partial view of the test suite detail report is shown below.
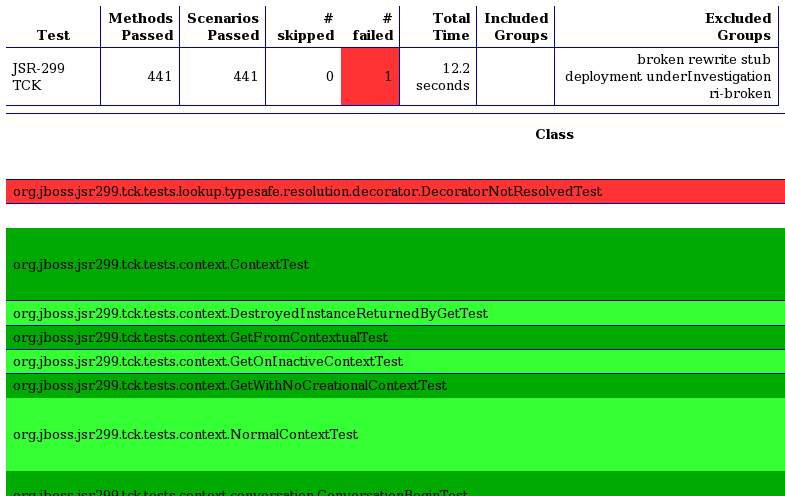
The test suite detail report is very useful, but it borderlines on complex. As an alternative, you can have a look at the emailable report, which is a single HTML document that shows much of the same information as the test suite detail report in a more compact layout. A partial view of the emailable report is shown below.
Now that you have seen two ways to get test results from the Maven test execution, let's switch over to the IDE, specifically Eclipse, and see how it presents TestNG test results.
After running a test in Eclipse, as described in Section 8.3, “Running a test in standalone mode” and Section 8.4, “Running integration tests”, the test results are displayed in the TestNG plugin view, as shown below.
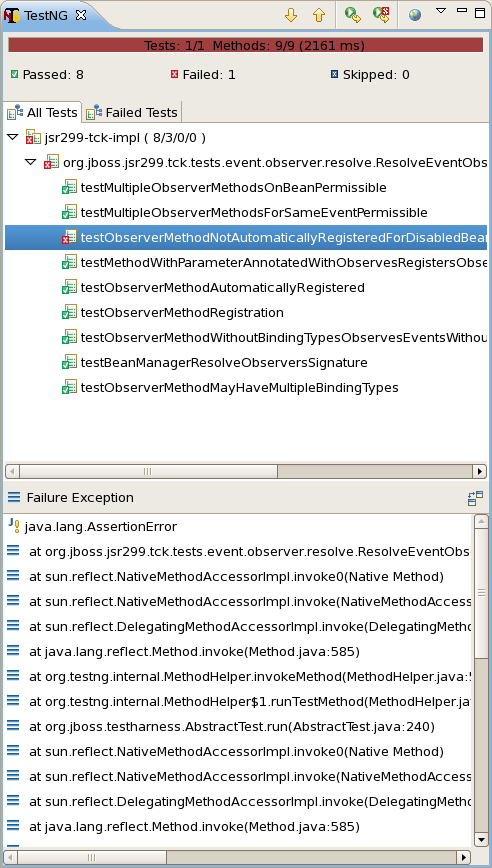
The view offers two lists. The first is a list of all methods (tests) in the class flagged as either passed or failed. The second is a list of methods (tests) in the class that failed. If there is a test failure, you can click on the method name to get the stacktrace leading up to the failure to display in the lower frame.
You can also find the raw output of the TestNG execution in the IDE console view. In that view, you can click on a test in the stacktrace to open it in the editor pane.
One of the nice features of TestNG is that it can keep track of which tests failed and offer to run only those tests again. You can also rerun the entire class. Buttons are available for both functions at the top of the view.