Even though business processes aren't code (we even recommend you to make them as high-level as possible and to avoid adding implementation details), they also have a life cycle like other development artefacts. And since business processes can be updated dynamically, testing them (so that you don't break any use cases when doing a modification) is really important as well.
When unit testing your process, you test whether the process behaves as expected in specific use cases, for example test the output based on the existing input. To simplify unit testing, jBPM includes a helper class called JbpmJUnitTestCase (in the jbpm-bpmn2 test module) that you can use to greatly simplify your junit testing, by offering:
- helper methods to create a new knowledge base and session for a given (set of)
process(es)
- you can select whether you want to use persistence or not
- assert statements to check
- the state of a process instance (active, completed, aborted)
- which node instances are currently active
- which nodes have been triggered (to check the path that has been followed)
- get the value of variables
- etc.
For example, conside the following hello world process containing a start event, a script task and an end event. The following junit test will create a new session, start the process and then verify whether the process instance completed successfully and whether these three nodes have been executed.

public class MyProcessTest extends JbpmJUnitTestCase {


   public void testProcess() {

       // create your session and load the given process(es)

       StatefulKnowledgeSession ksession = createKnowledgeSession("sample.bpmn");

       // start the process

       ProcessInstance processInstance = ksession.startProcess("com.sample.bpmn.hello");

       // check whether the process instance has completed successfully

       assertProcessInstanceCompleted(processInstance.getId(), ksession);

       // check whether the given nodes were executed during the process execution

       assertNodeTriggered(processInstance.getId(), "StartProcess", "Hello", "EndProcess");

   }

}
Several methods are provided to simplify the creation of a knowledge base and a session to interact with the engine.
- createKnowledgeBase(String... process): Returns a new knowledge base containing all the processes in the given filenames (loaded from classpath)
- createKnowledgeBase(Map<String, ResourceType> resources) :Returns a new knowledge base containing all the resources (not limited to processes but possibly also including other resource types like rules, decision tables, etc.) from the given filenames (loaded from classpath)
- createKnowledgeBaseGuvnor(String... packages): Returns a new knowledge base containing all the processes loaded from Guvnor (the process repository) from the given packages
- createKnowledgeSession(KnowledgeBase kbase): Creates a new statefull knowledge session from the given knowledge base
- restoreSession(StatefulKnowledgeSession ksession, boolean noCache) : completely restores this session from database, can be used to recreate a session to simulate a critical failure and to test recovery, if noCache is true, the existing persistence cache will not be used to restore the data
The following assertions are added to simplify testing the current state of a process instance:
- assertProcessInstanceActive(long processInstanceId, StatefulKnowledgeSession ksession): check whether the process instance with the given id is still active
- assertProcessInstanceCompleted(long processInstanceId, StatefulKnowledgeSession ksession): check whether the process instance with the given id has completed successfully
- assertProcessInstanceAborted(long processInstanceId, StatefulKnowledgeSession ksession): check whether the process instance with the given id was aborted
- assertNodeActive(long processInstanceId, StatefulKnowledgeSession ksession, String... name): check whether the process instance with the given id contains at least one active node with the given node name (for each of the given names)
- assertNodeTriggered(long processInstanceId, String... nodeNames) : check for each given node name whether a node instance was triggered (but not necessarily active anymore) during the execution of the process instance with the given
- getVariableValue(String name, long processInstanceId, StatefulKnowledgeSession ksession): retrieves the value of the variable with the given name from the given process instance, can then be used to check the value of process variables
Real-life business processes typically include the invocation of external services (like for example a human task service, an email server or your own domain-specific services). One of the advantages of our domain-specific process approach is that you can specify yourself how to actually execute your own domain-specific nodes, by registering a handler. And this handler can be different depending on your context, allowing you to use testing handlers for unit testing your process. When you are unit testing your business process, you can register test handlers that then verify whether specific services are requested correctly, and provide test responses for those services. For example, imagine you have an email node or a human task as part of your process. When unit testing, you don't want to send out an actual email but rather test whether the email that is requested contains the correct information (for example the right to email, a personalized body, etc.).
A TestWorkItemHandler is provided by default that can be registered to collect all work items (a work item represents one unit of work, like for example sending one specific email or invoking one specific service and contains all the data related to that task) for a given type. This test handler can then be queried during unit testing to check whether specific work was actually requested during the execution of the process and that the data associcated with the work was correct.
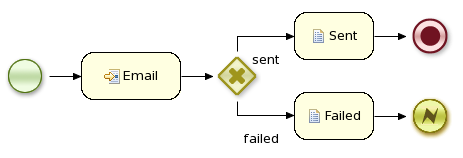
The following example describes how a process that sends out an email could be tested. This test case in particular will test whether an exception is raised when the email could not be sent (which is simulated by notifying the engine that the sending the email could not be completed). The test case uses a test handler that simply registers when an email was requested (and allows you to test the data related to the email like from, to, etc.). Once the engine has been notified the email could not be sent (using abortWorkItem(..)), the unit test verifies that the process handles this case successfully by logging this and generating an error, which aborts the process instance in this case.

public void testProcess2() {

    // create your session and load the given process(es)

    StatefulKnowledgeSession ksession = createKnowledgeSession("sample2.bpmn");

    // register a test handler for "Email"

    TestWorkItemHandler testHandler = new TestWorkItemHandler();

    ksession.getWorkItemManager().registerWorkItemHandler("Email", testHandler);

    // start the process

    ProcessInstance processInstance = ksession.startProcess("com.sample.bpmn.hello2");

    assertProcessInstanceActive(processInstance.getId(), ksession);

    assertNodeTriggered(processInstance.getId(), "StartProcess", "Email");

    // check whether the email has been requested

    WorkItem workItem = testHandler.getWorkItem();

    assertNotNull(workItem);

    assertEquals("Email", workItem.getName());

    assertEquals("me@mail.com", workItem.getParameter("From"));

    assertEquals("you@mail.com", workItem.getParameter("To"));

    // notify the engine the email has been sent

    ksession.getWorkItemManager().abortWorkItem(workItem.getId());

    assertProcessInstanceAborted(processInstance.getId(), ksession);

    assertNodeTriggered(processInstance.getId(), "Gateway", "Failed", "Error");

}
You can configure whether you want to execute the junit tests using persistence or not. By default, the junit tests will use persistence, meaning that the state of all process instances will be stored in a (in-memory H2) database (which is started by the junit test during setup) and a history log will be used to check assertions related to execution history. When persistence is not used, process instances will only live in memory and an in-memory logger is used for history assertions.
By default, persistence is turned on. To turn off persistence, simply pass a boolean to the super constructor when creating your test case, as shown below:
public class MyProcessTest extends JbpmJUnitTestCase {


    public MyProcessTest() {

        // configure this tests to not use persistence in this case

        super(false);

    }


    ...
This section describes how to debug processes using the Eclipse plugin. This means that the current state of your running processes can be inspected and visualized during the execution. Note that we currently don't allow you to put breakpoints on the nodes within a process directly. You can however put breakpoints inside any Java code you might have (i.e. your application code that is invoking the engine or invoked by the engine, listeners, etc.) or inside rules (that could be evaluated in the context of a process). At these breakpoints, you can then inspect the internal state of all your process instances.
When debugging the application, you can use the following debug views to track the execution of the process:
- The process instances view, showing all running process instances (and their state). When double-clicking a process instance, the process instance view visually shows the current state of that process instance at that point in time.
- The human task view, showing the task list of the given user (fill in the user id of the actor and click refresh to view all the tasks for the given actor), where you can then control the life cycle of the task, for example start and complete it.
- The audit view, showing the audit log (note that you should probably use a threaded file logger if you want to session to save the audit event to the file system on regular intervals, so the audit view can be update to show the latest state).
- The global data view, showing the globals.
- Other views related to rule execution like the working memory view (showing the contents (data) in the working memory related to rule execution), the agenda view (showing all activated rules), etc.
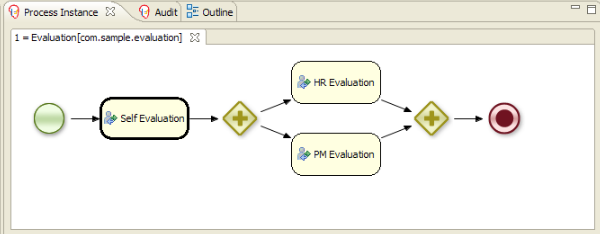
The process instances view shows the currently running process instances. The example shows that there is currently one running process (instance), currently executing one node instance, i.e. business rule task. When double-clicking a process instance, the process instance viewer will graphically show the progress of the process instance. An example where the process instance is waiting for a human actor to perform a self-evaluation task is shown below.

When you double-click a process instance in the process instances view and the process instance view complains that it cannot find the process, this means that the plugin wasn't able to find the process definition of the selected process instance in the cache of parsed process definitions. To solve this, simply change the process definition in question and save again (so it will be parsed) or rebuild the project that contains the process definition in question.

The Human Task View can connect to a running human task service and request the relevant tasks for a particular user (i.e. the tasks where the user is either a potential owner or the tasks that the user already claimed and is executing). The life cycle of these tasks can then be executed, i.e. claiming or releasing a task, starting or stopping the execution of a task, completing a task, etc. A screenshot of this Human Task View is shown below. You can configure which task service to connect to in the Drools Task preference page (select Window -> Preferences and select Drools Task). Here you can specify the url and port (default = 127.0.0.1:9123).

The audit view, showing the audit log, which is a log of all events that were logged from the session. To create a logger, use the KnowledgeRuntimeLoggerFactory to create a new logger and attach it to a session. Note that you should probably use a threaded file logger if you want to session to save the audit event to the file system on regular intervals, so the audit view can be update to show the latest state. When creating a threaded file logger, you can specify the name of the file where the audit log should be created and the interval after which event should be saved to the file (in milliseconds). Be sure to close the logger after usage.
KnowledgeRuntimeLogger logger = KnowledgeRuntimeLoggerFactory

   .newThreadedFileLogger(ksession, "logdir/mylogfile", 1000);

// do something with the session here

logger.close();
To open up an audit tree in the audit view, open the selected log file in the audit view or simply drag the file into the audit view. A tree-based view is generated based on the audit log. An event is shown as a subnode of another event if the child event is caused by (a direct consequence of) the parent event. An example is shown below.
