Imagine you are developing a BPM solution which mixes process with business data. Imagine also you need some forms to be used within processes in order to let the users enter data. Moreover, you'll likely want to have some kind of dashboards to display metrics and key performance indicators in order to quickly assess how your processes are doing. So far so good.
jBPM brings you all the ingredients you need to develop end-to-end business process solutions. The jBPM's BAM module (also known as Dashboard Builder or just Dashbuilder) allows for composing custom business dashboards mixing data coming from heterogeneous sources of information. The module is now fully integrated into KIE workbench. A new specific section for dealing with dashboards has been added and it can be accessed either from the home page or from the menu bar, as shown in the next figure.
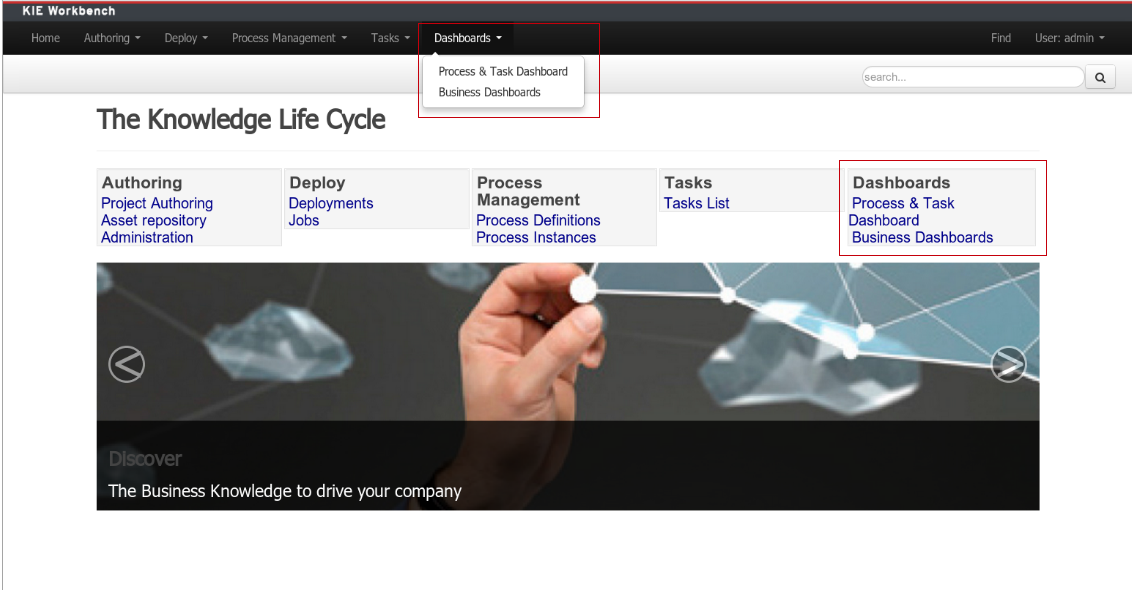
In the figure, Within the highlighted sections, there exists two options:
Business Dashboards: This option is intended to give users access to the generic dashboard tooling either to compose new dashboards or just to consume existing ones.
Process & Task Dashboard: It opens up the Process Dashboard perspective which contains several performance indicators related to the jBPM execution engine.
BPM solutions are not only made up with processes, rules or forms but also with data belonging to the customer business domain. Such data is handled in the forms, the rules and, of course, the dashboards that are part of the solution. Usually, dashboards feed with data coming from several sources of information, from business domain entities persisted into relational databases to data hold in legacy systems. In order to cope with this kind of scenarios a generic highly customizable dashboard tooling is needed.
It's obviously expected that a customer building a BPM solution want to track how its processes are performing. To do so the customer need a monitoring and reporting tool. This is the main reason why the Dashbuilder project has been included as a core module of the jBPM ecosystem. Notice also that Dashbuilder, as an independent project, is not only used by jBPM but also by many other projects like, for example, JBoss Teiid a data virtualization system that allows applications to use data from multiple, heterogeneous data stores.
Note
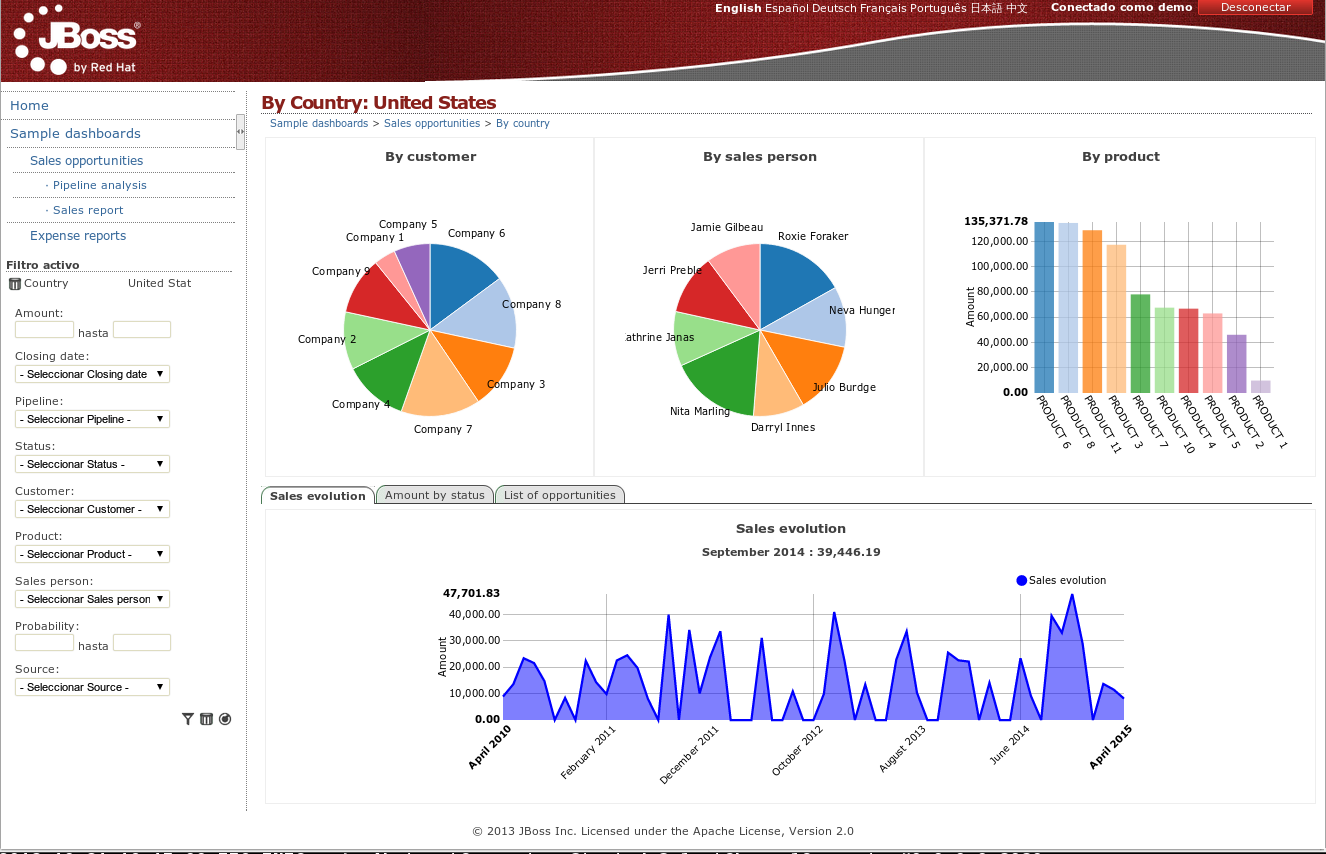
Please, read the Dashbuilder book in order to get detailed information about how to build custom dashboards.An example of dashboard is the Sales Dashboard which comes built-in any installation of Dashbuilder. Two screenshots below:
The jBPM Process Dashboard is an specific use case of a dashboard feed from data coming from a relational database via SQL queries. In this case, the database tables consumed are: processinstancelog and bamtasksummary both belonging to the jBPM engine.
From the data provider perspective there exists 3 data providers in charge of retrieving the data needed by all the key performance indicators of the jBPM Process Dashboard. These data provides are all defined in the Dashbuilder tooling data provider management screen.
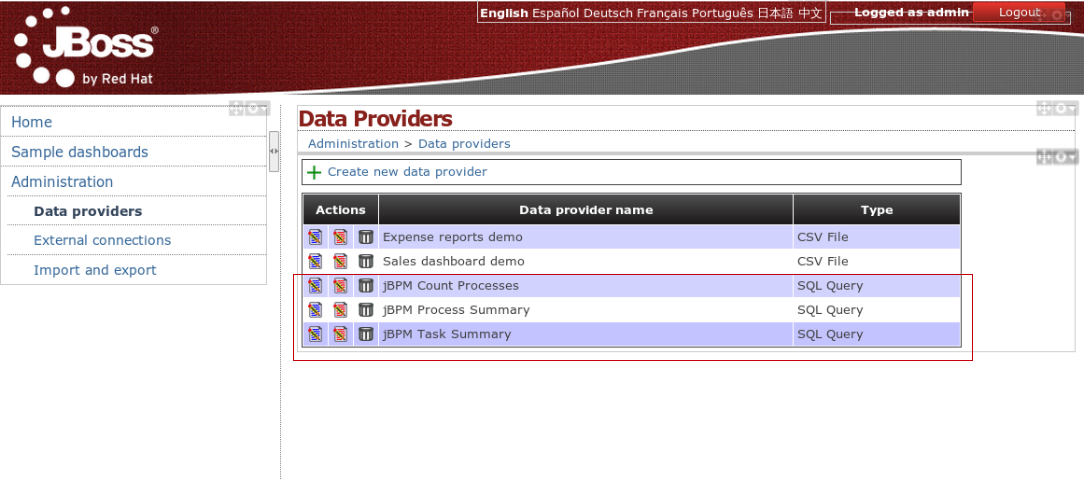
jBPM Count Processes: Retrieves the total number of process instances grouped by status.
        select total.processname, ifnull(total.instances,0) total,
        ifnull(active.instances_act,0) active,
        ifnull(completed.instances_compl,0) completed,
        ifnull(pending.instances_pend,0) pending,
        ifnull(suspended.instances_susp,0) suspended,
        ifnull(aborted.instances_abrt,0) aborted
        from
        (select pi.processinstanceid as pId, pi.processname as processname, count(*) as instances
        from processinstancelog pi group by pi.processinstanceid,processname) as total
        left outer join
        (select pi.processinstanceid as pId, count(*) as instances_act
        from processinstancelog pi
        where pi.status=1 group by pi.processinstanceid) as active
        on (total.pId=active.pId)
        left outer join
        (select pi.processinstanceid as pId, count(*) as instances_compl
        from processinstancelog pi
        where pi.status=2 group by pi.processinstanceid) as completed
        on (total.pId=completed.pId)
        left outer join
        (select pi.processinstanceid as pId, count(*) as instances_pend
        from processinstancelog pi
        where pi.status=0 group by pi.processinstanceid) as pending
        on (total.pId=pending.pId)
        left outer join
        (select pi.processinstanceid as pId, count(*) as instances_susp
        from processinstancelog pi
        where pi.status=4 group by pi.processinstanceid) as suspended
        on (total.pId=suspended.pId)
        left outer join
        (select pi.processinstanceid as pId, count(*) as instances_abrt
        from processinstancelog pi
        where pi.status=3 group by pi.processinstanceid) as aborted
        on (total.pId=aborted.pId)
        where {sql_condition, optional, processname, processname}
        order by processname
jBPM Process Summary: Retrieves data from all the process instances.
        select processinstanceid,
        processname,
        status,
        start_date,
        end_date,
        user_identity,
        processversion,
        duration
        from processinstancelog
jBPM Task Summary: Retrieves data from all the process tasks.
        select ts.taskid,
        ts.processinstanceid,
        ps.processname,
        ps.processversion,
        ts.taskname,
        ts.createddate,
        ts.enddate,
        ts.userid,
        ts.duration,
        ts.status
        from bamtasksummary ts
        left join processinstancelog ps on (ts.processinstanceid=ps.processinstanceid)
From the end user perspective, the jBPM Process Dashboard has been designed to consume the data from the data providers defined above. It has been also designed has a panel fully integrated into the KIE Workbench environment as shown in the next figure:
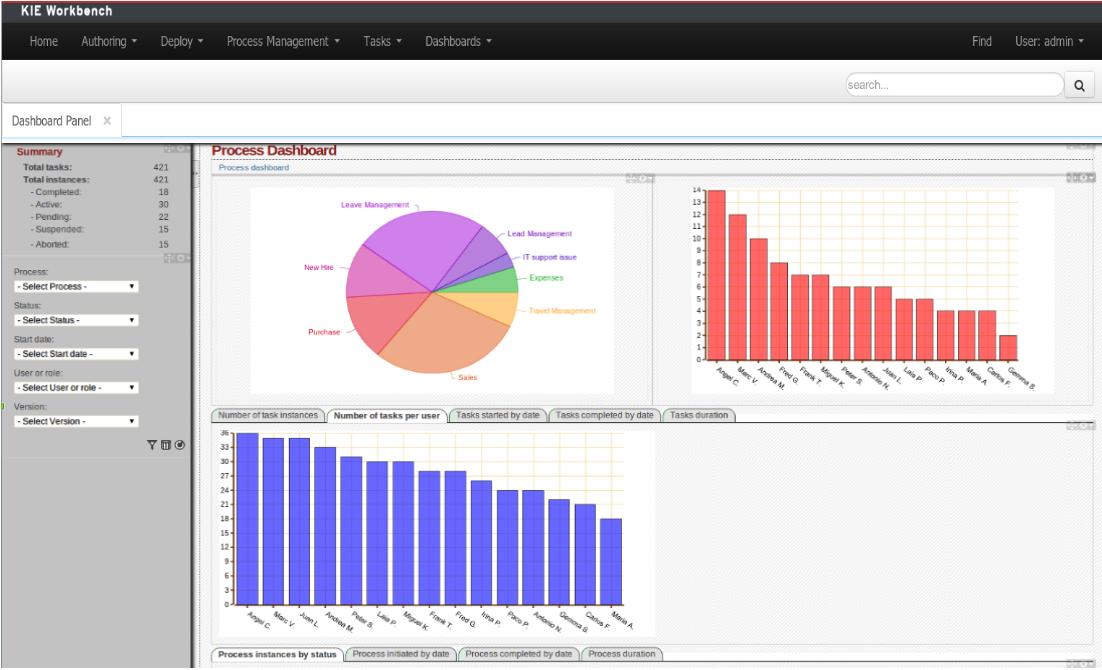
The dashboard itself is composed by two views or pages:
Global main view: containing metrics about all the processes.
Table 16.1. jBPM Process Dashboard: Global KPIs
Key Performance Indicator Data provider Total number of instances by process jBPM Count Processes Instances started by user jBPM Process Summary Total number of tasks by user/group jBPM Task Summary Number of tasks started by date jBPM Task Summary Number of tasks completed by date jBPM Task Summary Overall tasks duration (average, min. and max.) jBPM Task Summary Number of tasks by task status jBPM Task Summary Number of process instances by status jBPM Process Summary Number of process instances started by date jBPM Process Summary Number of process instances completed by date jBPM Process Summary Overall process instances duration (average, min. and max.) jBPM Process Summary Process detailed view: containing metrics about an specific process. To get into this view a process must be selected from the global view. Once a process is selected, a drill-down request is carried out by the system and the process specific view is set as the current screen.
Table 16.2. jBPM Process Dashboard: Process specific KPIs
Key Performance Indicator Data provider Total number of process instances by status jBPM Count Processes Total number of tasks by process version jBPM Task Summary Total number of tasks by user/group jBPM Task Summary Number of process tasks started by date jBPM Task Summary Number of process tasks completed by date jBPM Task Summary Overall tasks duration (average, min. and max.) jBPM Task Summary Number of tasks by task status jBPM Task Summary Number of process instances by status jBPM Process Summary Number of process instances started by date jBPM Process Summary Number of process instances completed by date jBPM Process Summary Overall process instances duration (average, min. and max.) jBPM Process Summary