This example, located in the samples/sla/monitor folder, demonstrates an approach to provide "Service Level Agreement" monitoring. This example makes uses of the example Switchyard application located in the samples/ordermgmt folder.
This example will show how:
-
activity event analysis, using the Event Processor Network mechanism, can be used to implement Service Level Agreements
- uses the Complex Event Processing (CEP) based event processor (using Drools Fusion)
-
impending or actual SLA violations can be reported for the attention of end users, via
- JMX notifications
- REST service
- to build a custom application to access the analysis results
This example shows a simple Service Level Agreement that checks whether a service response time exceeds expected levels. The CEP rule detects whether a situation of interest has occurred, and if so, creates a org.overlord.rtgov.analytics.situation.Situation object and initializes it with the appropriate description/severity information, before forwarding it back into the EPN. This results in the "Situation" object being published as a notification on the "Situations" subject.
The CEP rule is:
import org.overlord.rtgov.analytics.service.ResponseTime
import org.overlord.rtgov.analytics.situation.Situation

global org.overlord.rtgov.ep.EPContext epc

declare ResponseTime
    @role( event )
end

rule "check for SLA violations"
when
    $rt : ResponseTime() from entry-point "ServiceResponseTimes"
then

        if ($rt.getAverage() > 200) {
                epc.logError("\r\n\r\n**** RESPONSE TIME "+$rt.getAverage()+"ms EXCEEDED SLA FOR "+$rt.getServiceType()+" ****\r\n");

                Situation situation=new Situation();

                situation.setType("SLA Violation");
                situation.setSubject(Situation.createSubject($rt.getServiceType(), $rt.getOperation(),
                                                $rt.getFault()));
                situation.setTimestamp(System.currentTimeMillis());

                situation.getProperties().putAll($rt.getProperties());

                if ($rt.getRequestId() != null) {
                        situation.getActivityTypeIds().add($rt.getRequestId());
                }
                if ($rt.getResponseId() != null) {
                        situation.getActivityTypeIds().add($rt.getResponseId());
                }

                situation.getContext().addAll($rt.getContext());

                String serviceName=$rt.getServiceType();

                if (serviceName.startsWith("{")) {
                        serviceName = javax.xml.namespace.QName.valueOf(serviceName).getLocalPart();
                }

                if ($rt.getAverage() > 400) {
                        situation.setDescription(serviceName+" exceeded maximum response time of 400 ms");
                        situation.setSeverity(Situation.Severity.Critical);
                } else if ($rt.getAverage() > 320) {
                        situation.setDescription(serviceName+" exceeded response time of 320 ms");
                        situation.setSeverity(Situation.Severity.High);
                } else if ($rt.getAverage() > 260) {
                        situation.setDescription(serviceName+" exceeded response time of 260 ms");
                        situation.setSeverity(Situation.Severity.Medium);
                } else {
                        situation.setDescription(serviceName+" exceeded response time of 200 ms");
                        situation.setSeverity(Situation.Severity.Low);
                }

                epc.handle(situation);
        }

end
The "out of the box" active collection configuration is pre-initialized with a collection for the org.overlord.rtgov.analytics.situation.Situation objects, subscribing to the "Situations" subject from the Event Processor Network. Therefore any detected SLA violations will automatically be stored in this collection (accessible via a RESTful service), and reported to the associated JMX notifier.
To install the example, the first step is to start the Switchyard server using the following command from the bin folder:
./standalone.sh -c standalone-full.xml
The next step is to install the example Switchyard application, achieved by running the following command from the ${rtgov}/samples/ordermgmt folder:
mvn jboss-as:deploy
Then run the same command from the ${rtgov}/samples/sla/epn and ${rtgov}/samples/sla/monitor folders.
To demonstrate a Service Level Agreement violation, we will send the following message to the example Switchyard application at the following URL: http://localhost:8080/demo-orders/OrderService
<soap:Envelope xmlns:soap="http://schemas.xmlsoap.org/soap/envelope/">
   <soap:Body>
      <orders:submitOrder xmlns:orders="urn:switchyard-quickstart-demo:orders:1.0">
         <order>
            <orderId>3</orderId>
            <itemId>JAM</itemId>
            <quantity>400</quantity>
            <customer>Fred</customer>
         </order>
      </orders:submitOrder>
   </soap:Body>
</soap:Envelope>
The message can be sent using an appropriate SOAP client (e.g. SOAP-UI) or by running the test client available with the Switchyard application, by running the following command from the ${rtgov}/samples/ordermgmt/app folder:
mvn exec:java -Dreq=order3
The itemId of "JAM" causes a delay to be introduced in the service, resulting in a SLA violation being detected. This violation can be viewed using two approaches:
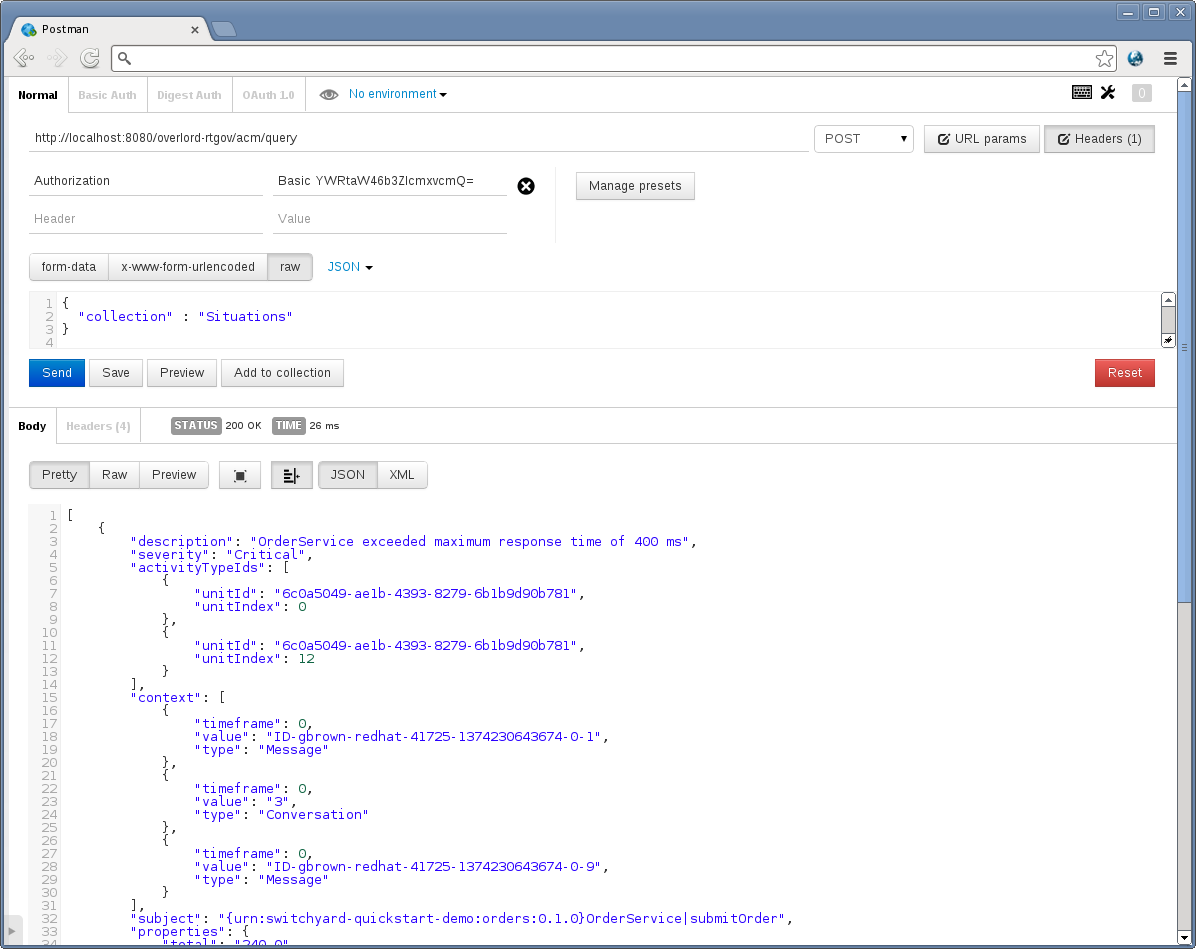
Using a suitable REST client, send the following POST to: http://localhost:8080/overlord-rtgov/acm/query (using content-type of "application/json", username is admin and password is overlord)
{
    "collection" : "Situations"
}
This will result in the following response:
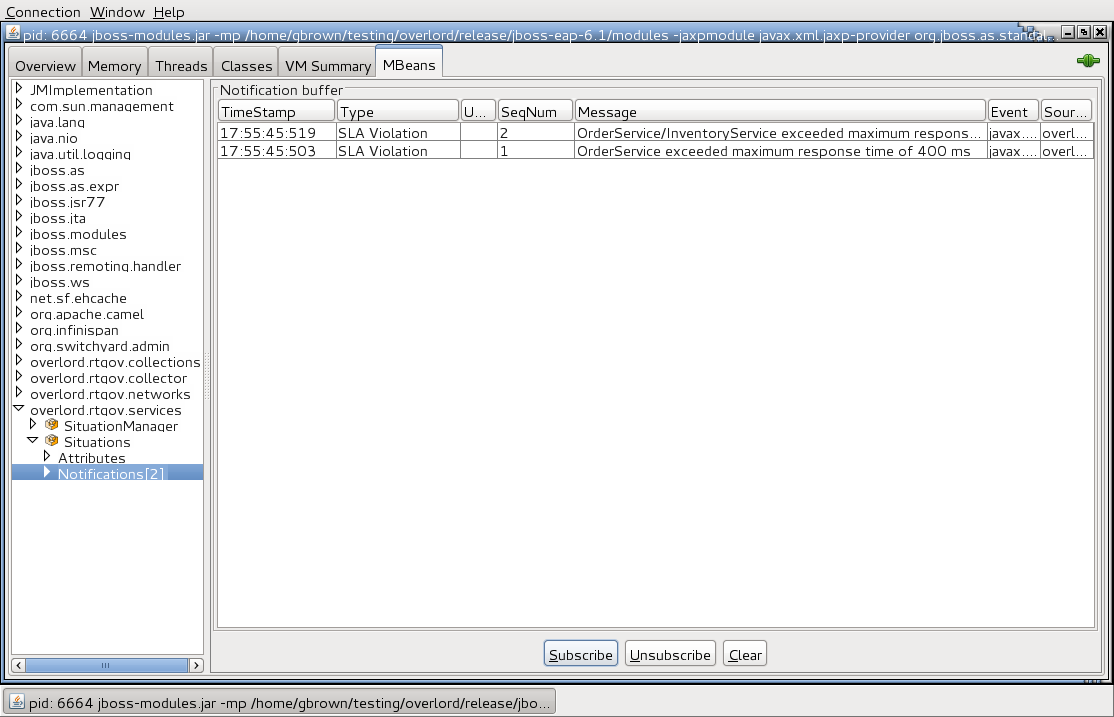
The Situations active collection source also generates JMX notifications that can be subscribed to using a suitable JMX management application. For example, using JConsole we can view the SLA violation:
As well as having access to the information via REST or JMX, it may also be desirable to have more direct access to the active collection results. This section describes the custom app defined in the ${rtgov}/samples/sla/monitor folder.
The following code shows how the custom application initializes access to the relevant active collections:
@Path("/monitor")
@ApplicationScoped
public class SLAMonitor {

    private static final String SERVICE_RESPONSE_TIMES = "ServiceResponseTimes";
    private static final String SITUATIONS = "Situations";

    private static final Logger LOG=Logger.getLogger(SLAMonitor.class.getName());

    private ActiveCollectionManager _acmManager=null;

    private ActiveList _serviceResponseTime=null;
    private ActiveList _situations=null;

    /**
     * This is the default constructor.
     */
    public SLAMonitor() {

        try {
            _acmManager = ActiveCollectionManagerAccessor.getActiveCollectionManager();

            _serviceResponseTime = (ActiveList)
                    _acmManager.getActiveCollection(SERVICE_RESPONSE_TIMES);

            _situations = (ActiveList)
                    _acmManager.getActiveCollection(SITUATIONS);

        } catch (Exception e) {
            LOG.log(Level.SEVERE, "Failed to initialize active collection manager", e);
        }

    }
Then when the REST request is received (e.g. for SLA violations defined as Situations),
    @GET
    @Path("/situations")
    @Produces("application/json")
    public java.util.List<Situation> getSituations() {
        java.util.List<Situation> ret=new java.util.ArrayList<Situation>();

        for (Object obj : _situations) {
            if (obj instanceof Situation) {
                ret.add((Situation)obj);
            }
        }

        return (ret);
    }
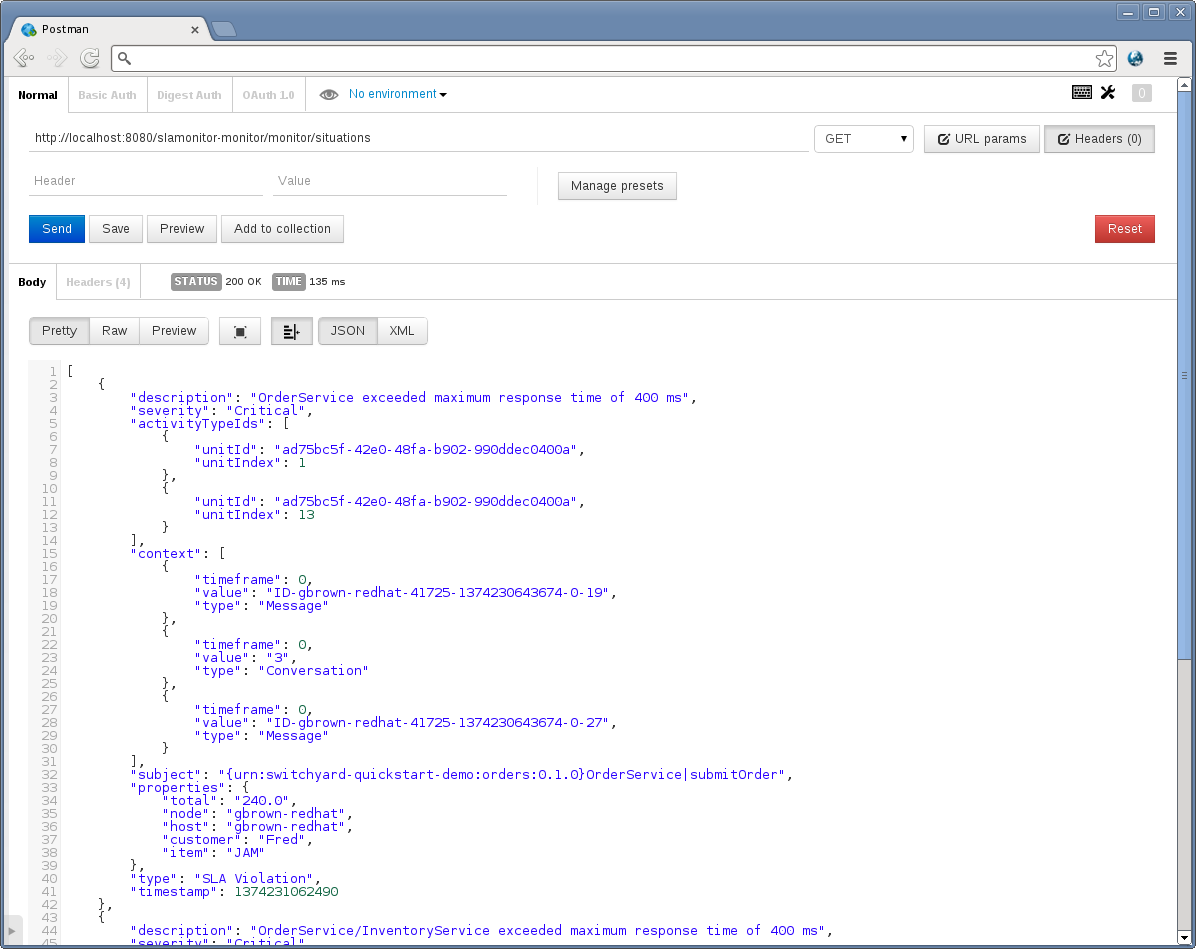
To see the SLA violations, send a REST GET request to: http://localhost:8080/slamonitor-monitor/monitor/situations
This will return the following information:
It is also possible to request the list of response time information from the same custom service, using the URL: http://localhost:8080/slamonitor-monitor/monitor/responseTimes?operation=submitOrder
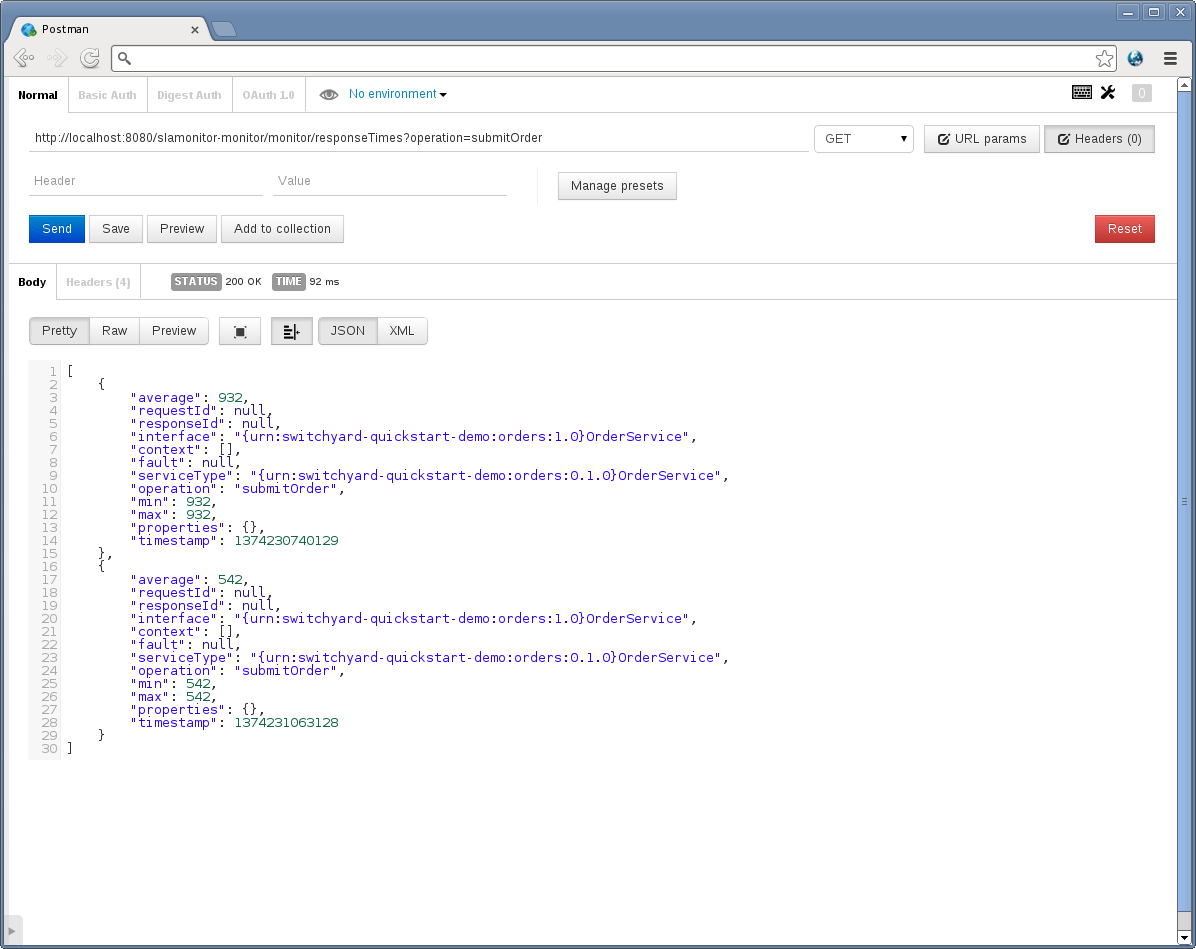
Caution
If no query parameter is provided, then response times for all operations will be returned.
This quickstart demonstrates how Service Level Agreements can be policed using rules defined in an Event Processor Network, and reporting to end users using the pre-configured "Situations" active collection.
The rule used in this example is simple, detecting whether the response time associated with an operation on a service exceeds a particular level. However more complex temporal rules could be defined to identify the latency between any two points in a business transaction flow.
This example, located in the samples/sla/report folder, demonstrates how to provide pluggable reports that can access information in the activity store. This particular example uses the activity information to compile a Service Level Agreement report, highlighting violations above a specified response time.
This example will show how:
- to configure a pluggable report
- to generate the report via a REST API
This example provides a simple Service Level Agreement report, based on identifying service invocations that exceed a specified maximum response time over an optionally specified averaged duration. If the averaged duration is not specified, then each service invocation will be checked to determine if it exceeded the maximum response time - and if so, get added to the report. If the averaged duration is specified, then when an invocation is detected (that exceeds the max response time), then all other suitable invocations within the specified duration are averaged to determine if the response time overall still exceeds the specified maximum. This is to ensure that periodic spikes are not unnecessarily reported.
It is also possible to optionally specify a business calendar, which can be used to determine the business period in which activities are of interest. If SLA violations occur outside the specified business calendar, then they are not relevant.
The report definition is:
[
  {
    "name" : "SLAReport",
    "generator" : {
      "@class" : "org.overlord.rtgov.reports.MVELReportGenerator",
       "scriptLocation" : "SLAReport.mvel"
    }
  }
]
The MVEL based report generator script can be found in the ${rtgov}/samples/sla/report/src/main/resources folder.
Note
Currently the report parameters serviceType, operation and principal are not used.
To install the example, the first step is to start the Switchyard server using the following command from the bin folder:
./standalone.sh -c standalone-full.xml
Then run the same command from the ${rtgov}/samples/sla/report folder.
To demonstrate a Service Level Agreement report, we will need to create some relevant activities that can be reported upon. Send multiple instances of the following messages to the example Switchyard application at the following URL: http://localhost:8080/demo-orders/OrderService
<soap:Envelope xmlns:soap="http://schemas.xmlsoap.org/soap/envelope/">
   <soap:Body>
      <orders:submitOrder xmlns:orders="urn:switchyard-quickstart-demo:orders:1.0">
         <order>
            <orderId>1</orderId>
            <itemId>BUTTER</itemId>
            <quantity>100</quantity>
            <customer>Fred</customer>
         </order>
      </orders:submitOrder>
   </soap:Body>
</soap:Envelope>

<soap:Envelope xmlns:soap="http://schemas.xmlsoap.org/soap/envelope/">
   <soap:Body>
      <orders:submitOrder xmlns:orders="urn:switchyard-quickstart-demo:orders:1.0">
         <order>
            <orderId>3</orderId>
            <itemId>JAM</itemId>
            <quantity>100</quantity>
            <customer>Fred</customer>
         </order>
      </orders:submitOrder>
   </soap:Body>
</soap:Envelope>
Note
Send quite a few of the second message, as this is the one that will result in SLA violations.
The message can be sent using an appropriate SOAP client (e.g. SOAP-UI) or by running the test client available with the Switchyard application, by running the following commands from the ${rtgov}/samples/ordermgmt/app folder:
mvn exec:java -Dreq=order1
mvn exec:java -Dreq=order3
To generate a report, we will send a GET request to the following URL:
http://localhost:8080/overlord-rtgov/report/generate?report=SLAReport
  &startDay=1&startMonth=1&startYear=2013&endDay=31&endMonth=12
  &endYear=2013&maxResponseTime=400&averagedDuration=450
(using the Basic Authentication username admin and password overlord).
Note
This URL has been shown over multiple lines for readability, but must be entered as a single line within a REST client.
This will return a report (with name SLAReport) containing violations that occur within the year 2013. If you wish to experiment with the default business calendar, then append "&calendar=Default" to the end of the URL. This will also identify what percentage of the business working period has been impacted by the SLA violations.