This section describes the gadgets available for displaying runtime governance information.
Overlord RTGov uses a gadget server to display runtime governance information via a set of configurable gadgets. These gadgets will be described in the following sections.
To access the gadget server, when the server has been started, using the url: <host>/gadget-web
Once displayed, it will request the username and password. A default user is provided called admin with password overlord.
When the gadget UI is displayed the first time for a user, they will need to add a new page (by pressing the + button) before going to the Gadget Store to select the gadgets they wish to view.
The Response Time gadget shows average, minimum and maximum summary metrics from the service operations invoked over a period of time.
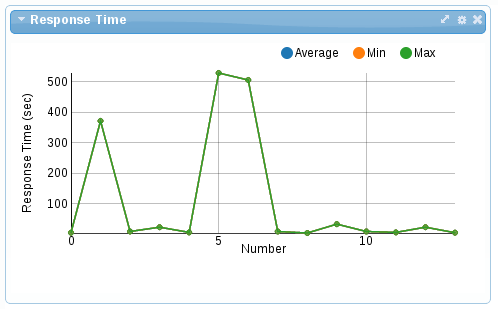
The gadget configuration can be used to select a particular service to display. It is also possible to customize the gadget further to display only the metrics from a particular operation on that service.
The Situations gadget displays "situations of interest" that have been raised during the processing of the activity events.
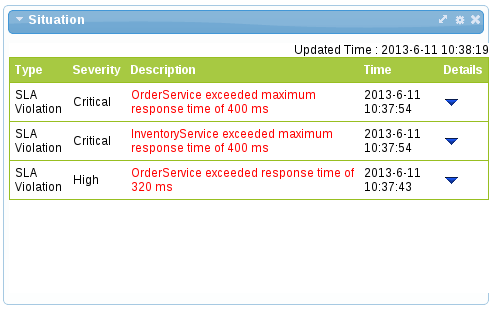
In this particular case, the situations are highlighting Service Level Agreement violations, but event processors can create situations to reflect any area of concern that needs to be bought to the attention of users.
The details column provides a button to expand the row to show the details regarding a situation.
The Call Trace gadget provides the means to display the invocation flow of a particular business transaction instance.
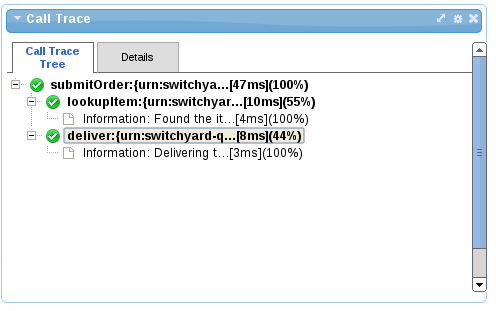
The business transaction is identifed by entering its globally unique identifier in the gadget’s configuration.
The Service Overview gadget provides a graphical representation of the dependencies (invocation/usage) between services. When displayed as part of a group of gadgets, the representation does not contain any text - simply showing the status of each service (and link) as a color (green being normal).
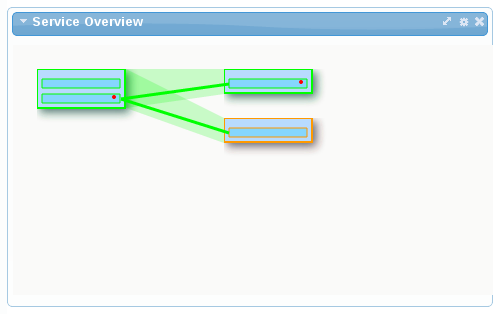
If the gadget is enlarged, further details are included, such as the service and operation names, aswell as metrics being available by hovering over the item of interest.
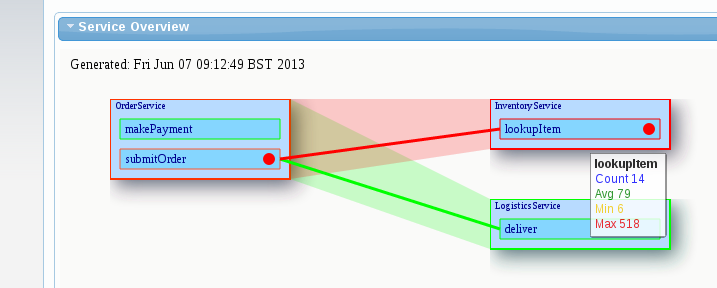
When a situation is reported against a particular service or operation, a red dot will be displayed on that component which can be used to view some of the situations (if multiple - for a full list, the user should see the Situations gadget).