This chapter describes how to debug rules during the execution of your Drools application.
This section will focus on how to add breakpoints in the consequences of your rules.
Whenever such a breakpoint is encountered during the execution of the rules, the execution is halted. Once the execution is halted, it's possible to inspect the variables known at that point and use any of the default debugging actions to decide what should happen next (step over, continue, etc). To inspect the content of the working memory and agenda the Debug views can be used.
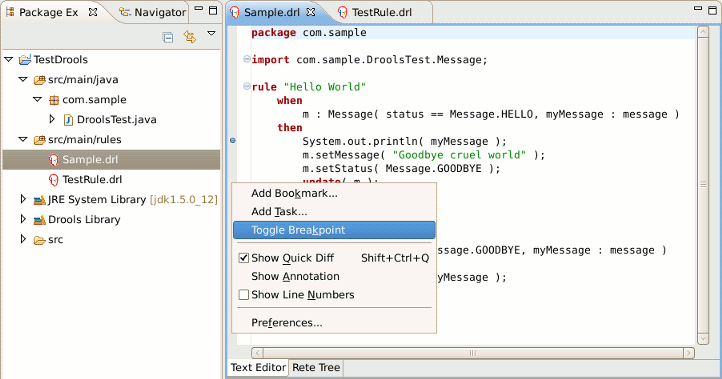
To create breakpoints in the Package Explorer view or Navigator view of the Drools perspective, double-click the selected .drl file to open it in the editor. In the example below we opened Sample.drl file.
You can add and remove rule breakpoints in the .drl files in two ways, similar to the way breakpoints are added to Java files:
Double-click the ruler in the Rule editor at the line where you want to add a breakpoint.
Tip:
Note that rule breakpoints can only be created in the consequence of a rule. Double-clicking on a line where no breakpoint is allowed will do nothing.
A breakpoint can be removed by double-clicking the ruler once more.
Right-click the ruler. Select the action in the context menu. Choosing this action will add a breakpoint at the selected line or remove it if there is one already.
The Debug perspective contains a Breakpoints view which can be used to see all defined breakpoints, get their properties, enable/disable or remove them, etc. You can switch to it by navigating to → → → .
Drools breakpoints are only enabled if you debug your application as a Drools Application. To do this you should perform one of the actions:
Select the main class of your application. Right click it and select → .
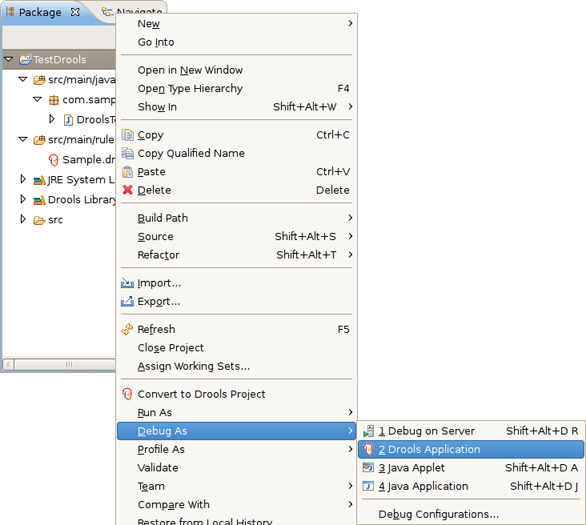
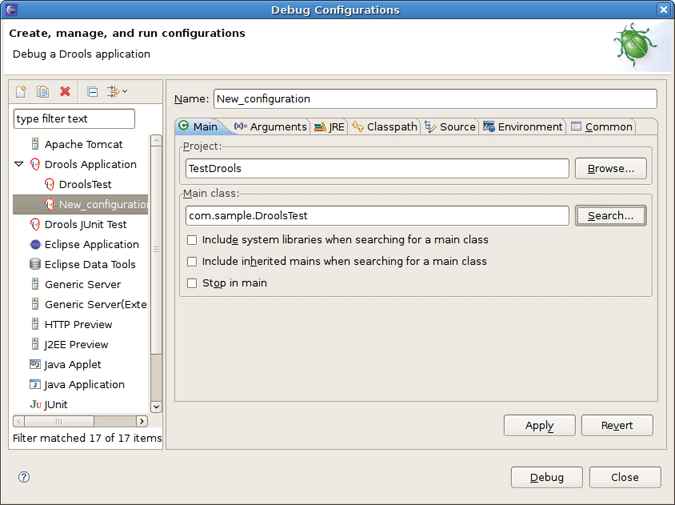
Alternatively, you can also select → to open a new dialog for creating, managing and running debug configurations.
Select the Drools Application item in the left tree and click the button (leftmost icon in the toolbar above the tree). This will create a new configuration with a number of the properties already filled in (like the Project and Main class) based on main class you selected in the beginning. All properties shown here are the same as any standard Java program.
Tip:
Remember to change the name of your debug configuration to something meaningful.
Next click the button on the bottom to start debugging your application.
After enabling the debugging, the application starts executing and will halt if any breakpoint is encountered. This can be a Drools rule breakpoint, or any other standard Java breakpoint. Whenever a Drools rule breakpoint is encountered, the corresponding .drl file is opened and the active line is highlighted. The Variables view also contains all rule parameters and their value. You can then use the default Java
debug actions to decide what to do next (resume, terminate, step over, etc). The debug views can also be used to determine the contents of the working memory and agenda at that time as well (you don't have to select a working memory now, the current executing working memory is automatically shown).